
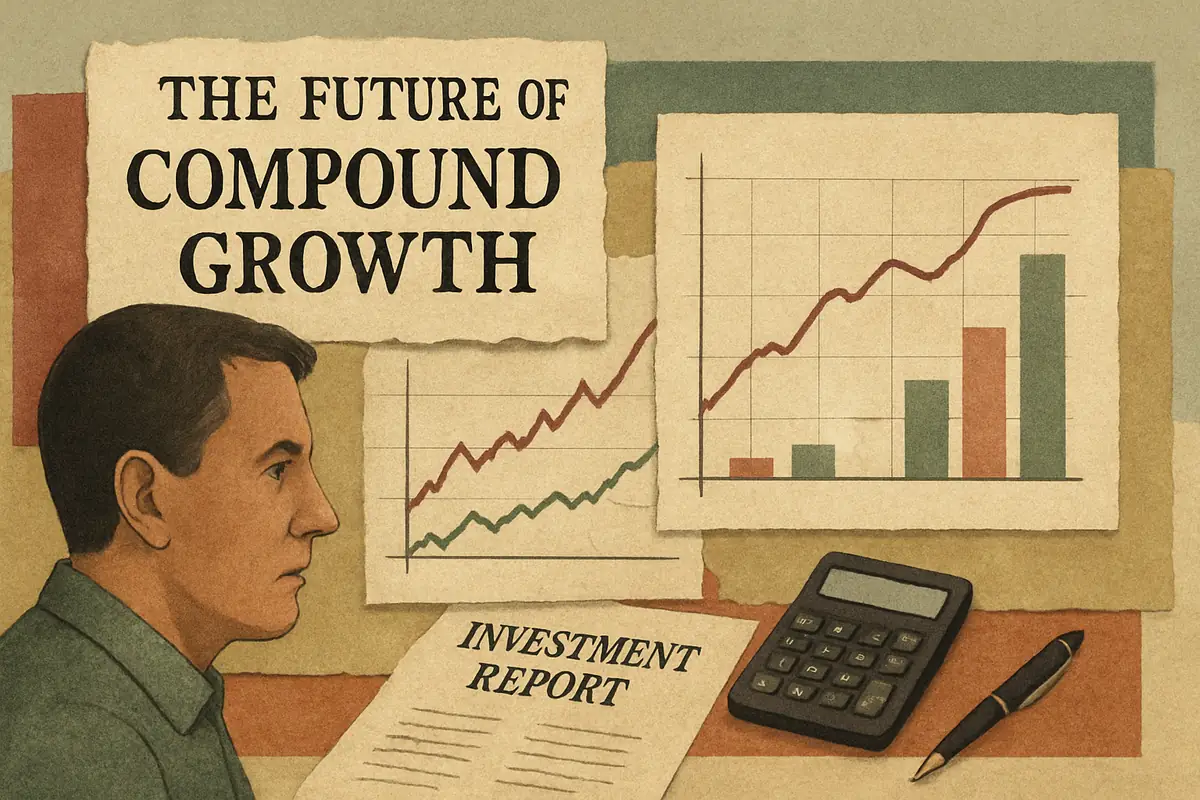
Compound growth is a central force behind wealth accumulation, enabling investments to multiply over time as earnings are reinvested. However, the pace and consistency of compounding are shaped by shifting global financial cycles, risk premiums, and valuation levels. As these dynamics evolve, the assumptions that once supported steady compound returns require rigorous re-examination. This article delves into the real-world trade-offs and numeric realities influencing compound growth’s potential in the coming decades.
Historical Context: Compound Growth Through Market Cycles
Compound growth, which refers to earning returns not only on an initial investment but also on prior gains, has fueled significant wealth creation across generations. For example, over the past 50 years, broad U.S. equity markets have delivered average annualized returns in the 7% to 10% range, while long-term government bonds have typically returned between 4% and 6% per year. These returns, when compounded, can multiply an initial investment several times over a few decades. The post-World War II period, from 1945 to 1970, saw especially robust compounding as economies rebuilt and technology advanced, with some equity portfolios doubling every 7 to 10 years at historical rates.
Yet, compounding is rarely linear. Periods like the 1970s stagflation or the 2000-2002 dot-com bust brought negative returns, temporarily halting or reversing compounding progress. Entry points are critical: investing at a market peak, when price-to-earnings (P/E) ratios exceed 20 to 25, has historically led to lower 10-year compounded returns compared to entering during bear markets, when P/E ratios may fall below 13. Liquidity conditions and risk premiums—extra returns demanded by investors for taking on additional risk—are also key. For example, in times of crisis, risk premiums can widen by 2 to 4 percentage points, compressing valuations and altering compounding trajectories.
Interest Rates and Their Impact on Compound Returns
Interest rates, which represent the cost of borrowing and the return on savings, fundamentally influence compound growth across asset classes. In the 1980s and 1990s, falling policy rates—declining from double digits to below 5%—lowered discount rates (the rate used to calculate the present value of future cash flows), boosting asset prices and compounding. Conversely, low bond yields, such as the 1% to 2% range seen in the 2010s, reduced interest income but often led to capital gains as rates fell further.
Today, with central banks signaling higher terminal rates—potentially settling between 3% and 5%—the environment is shifting. Higher rates increase the discount rate applied to future earnings, often resulting in lower present valuations for stocks and bonds. For example, a 1% rise in rates can reduce the present value of a 10-year cash flow stream by roughly 8% to 10%. Investors may see total returns moderate, even if corporate earnings continue to grow at 5% to 7% annually, because higher rates can offset these gains through valuation compression.
Where readers should be careful
When interest rates rise, fixed income portfolios face reinvestment risk—the risk that proceeds from maturing bonds must be reinvested at lower yields—and equities can experience heightened volatility as discount rates adjust. The balance between nominal rates and inflation expectations will determine real (inflation-adjusted) compound returns.
Valuation Metrics: Interpreting Forward-Looking Indicators Against Historical Norms
Valuation metrics, such as the price-to-earnings (P/E) ratio (the price of a stock divided by its earnings per share) and dividend yield (annual dividends per share divided by price), are essential for forecasting compound growth. When P/E ratios surpass historical averages—typically 15 to 18 for major indices—future compounded returns tend to be lower. For instance, entering the market when the S&P 500’s P/E is over 22 has historically led to 10-year annualized returns of 4% to 6%, compared to 8% to 10% when entering at P/E ratios below 15.
Forward-looking analysis now incorporates scenario planning around corporate profitability, changing tax rates, and regulatory shifts. For example, a 2% change in corporate tax rates can impact after-tax earnings growth, while new regulations in technology or energy sectors can alter long-term cash flow projections. Static benchmarks may not capture these complexities, so dynamic models are increasingly used to estimate compounding potential in the face of evolving fiscal and technological landscapes.
Liquidity Conditions and Market Depth Influencing Compounding Opportunities
Liquidity—the ease with which assets can be bought or sold without affecting their price—directly impacts the realization of compound returns. In deep, liquid markets, bid-ask spreads (the difference between the buying and selling price) may be as low as 0.01% to 0.10% for large-cap stocks, minimizing transaction costs and supporting efficient compounding. During periods of ample liquidity, investors can rebalance portfolios more easily, maintaining target allocations and risk levels.
However, when liquidity tightens—due to monetary policy shifts or geopolitical events—transaction costs can rise, and market depth (the volume available at each price level) can thin. In small-cap equities or emerging market bonds, bid-ask spreads can widen to 0.5% or more, and price impact from trades can erode returns. This dynamic can hinder compounding, especially during market stress when liquidity may evaporate for days or weeks, making it difficult to execute trades at favorable prices.
| Factor | Effect on Compound Growth | Associated Risks |
|---|---|---|
| Interest Rates Rising | Compresses valuations; increases discount rates leading to slower growth | Reinvestment risk; heightened asset price volatility |
| Valuation Levels Elevated | Limits upside potential for price appreciation despite earnings growth | Risk of multiple contraction diminishing returns |
| Liquidity Tightening | Increases transaction costs; impairs market access for rebalancing | Market dislocations; increased slippage |
| Inflation Volatility | Erodes real returns; complicates forecasting cash flow growth | Unexpected inflation shocks reducing purchasing power |
Risk Premium Adjustments: How Investor Sentiment and Compensation Shift Compound Returns
The risk premium—the extra return investors require for taking on additional risk, such as holding stocks over government bonds—fluctuates with market sentiment and uncertainty. Historically, equity risk premiums have ranged from 3% to 6% above risk-free rates, but during periods of stress or uncertainty, they can spike to 7% or higher, pushing asset prices down. When risk premiums normalize, disciplined investors may benefit from above-average compounding as valuations recover.
However, persistently elevated risk premiums can suppress capital appreciation, as higher required returns mean lower current prices. For example, if the risk-free rate is 4% and the required risk premium rises from 4% to 6%, the present value of future earnings drops, reducing the starting point for compounding. This underscores the importance of monitoring shifts in risk appetite and being prepared for delayed return realization during periods of systemic uncertainty.
Asset Class Considerations: Compounding in Equities Versus Fixed Income
The relationship between equities and fixed income is evolving. Fixed income assets, such as government and corporate bonds, have historically offered yields between 3% and 6%, but recent years have seen yields drop below 2% in many developed markets. As central banks normalize rates, bond prices can fall, and the traditional role of bonds as stable compounders is challenged.
Equities, on the other hand, offer higher return potential but with greater volatility. For example, technology stocks have delivered annualized returns of 10% to 15% over the past decade, but with year-to-year swings of 20% or more. Sector rotation—shifting allocations toward sectors like healthcare or technology—can amplify or dampen compounding depending on timing and market cycles. Broad index strategies, such as investing in the S&P 500, have historically provided more stable compounding, but concentration in high-growth sectors can lead to asymmetric outcomes.
Technological Innovation’s Role in Extending Compound Horizons
Technological advances, such as automation and artificial intelligence, can enhance long-term compounded returns by driving productivity and enabling scalable business models. For instance, companies that reinvest 20% to 30% of revenues into research and development may outpace peers in growth, leading to higher compounded earnings. However, sector concentration—where a handful of technology firms represent 25% or more of a major index—can increase portfolio risk if innovation cycles falter or valuations become stretched.
Disruptive technologies also create uncertainty for established firms, affecting earnings visibility and valuation models. For example, a new entrant capturing 10% market share in a key industry can erode incumbents’ growth rates, impacting compounding projections. Investors must balance optimism for high-growth sectors with caution around inflated multiples, which can exceed 30 to 40 times earnings in periods of exuberance.
Where readers should be careful
Scenarios where technological disruption accelerates can offer significant upside for compounding, but also carry risks of mispricing or rapid obsolescence, especially when valuations are based on optimistic assumptions about future growth.
Behavioral Dynamics Impacting Long-Term Compounding Outcomes
Behavioral finance—the study of how psychological factors influence investment decisions—reveals that biases like herd mentality and recency bias often prompt investors to make premature portfolio changes. For example, during market corrections of 15% to 30%, many investors lock in losses by selling at lows, missing subsequent recoveries that fuel compounding. Over a 30-year period, missing just the 10 best days in the market can reduce total returns by more than 30% compared to a buy-and-hold strategy.
Volatility-induced reactions can also lead to chasing momentum or abandoning long-term plans, undermining the cumulative wealth achievable through disciplined compounding. Building habits such as automatic investing and periodic rebalancing can help mitigate these behavioral pitfalls and support consistent compounding.
Policy Frameworks: How Monetary and Fiscal Interactions Shape Compound Prospects
The interaction between monetary policy (central bank actions on interest rates and money supply) and fiscal policy (government spending and taxation) exerts a powerful influence on compounded investment outcomes. For example, expansionary fiscal policy—such as stimulus packages of $500 billion or more—can boost asset prices and short-term compounding, but may also raise debt-to-GDP ratios above 100%, increasing long-term volatility and inflation risk.
While fiscal stimulus can temporarily lift nominal returns, sustained high debt levels and tightening monetary policy can create uncertainty around real (inflation-adjusted) compounding. In one scenario, coordinated policy targeting 2% inflation and stable real yields supports steady compounding. In another, fiscal dominance and unexpected inflation—rising above 4%—can erode real wealth, even if nominal returns appear strong.
Balancing Trade-Offs: Strategic Implications For Investors Considering Compound Growth
With the old paradigm of persistently low interest rates and stable inflation shifting, investors face complex trade-offs. Equities weighted toward innovation sectors may offer higher but more volatile returns—potentially annualizing at 8% to 12% but with drawdowns of 20% or more—while fixed income may deliver steadier, lower returns in the 3% to 5% range, yet remain vulnerable to rate shocks.
Investors must weigh these options in constructing portfolios, considering factors such as risk tolerance, investment horizon, and the need for liquidity. For example, a younger investor with a 30-year horizon may prioritize higher compounding potential in equities, while a retiree may focus on capital preservation and predictable income.
Emerging Technologies and Their Impact on Compound Growth
Emerging technologies like artificial intelligence (AI), blockchain, and big data analytics are transforming investment strategies and the mechanics of compounding. AI-powered algorithms can analyze thousands of securities and market signals in real time, dynamically adjusting portfolios to maximize returns. Blockchain technology, which is a decentralized ledger system, enhances transaction security and transparency, reducing risks like fraud that can erode compounded gains. Big data enables investors to process vast amounts of information, identifying trends that can inform asset allocation and enhance compounding potential.
For example, robo-advisors—automated investment platforms powered by AI—typically charge annual fees between 0.2% and 0.5%, compared to 1% or more for traditional advisors. These platforms rebalance portfolios automatically, helping investors stay on track for long-term compounding. In decentralized finance (DeFi), blockchain-based platforms allow users to earn yields of 3% to 12% by lending or staking digital assets, though these returns can be volatile and subject to regulatory changes. While technology expands opportunities for compounding, it also introduces new risks, such as cybersecurity threats and evolving legal frameworks, requiring ongoing vigilance.
Behavioral Economics: Overcoming Psychological Barriers to Compound Growth
Despite the mathematical power of compounding, investor psychology often stands in the way of fully realizing its benefits. Biases like loss aversion—the tendency to fear losses more than value equivalent gains—can prompt premature withdrawals, while impatience and overconfidence may lead to frequent trading. For example, investors who switch strategies every 2 to 3 years often underperform those who hold for 10 years or more, missing out on the exponential growth that comes from long-term compounding.
Tools such as automatic contributions and commitment devices (mechanisms that lock in future behavior) can help counteract impulsive decisions. Financial education, including exposure to compound growth simulations—such as seeing how $10,000 invested at 7% grows to nearly $76,000 over 30 years—can shift mindsets toward long-term thinking. Advisors increasingly focus on behavioral coaching, helping clients remain resilient during downturns and avoid actions that disrupt compounding.
Global Economic Trends Shaping Compound Growth Opportunities
Global macroeconomic trends continue to shape compounding opportunities. In developed economies, prolonged periods of low interest rates—often below 2%—have driven investors toward equities, real estate, and emerging markets in search of higher returns. Meanwhile, demographic changes, such as aging populations in Europe and Japan and youthful demographics in parts of Asia and Africa, influence consumption patterns and growth prospects. These shifts can affect sector performance and regional compounding rates, with some emerging markets offering annualized returns of 8% to 12% but with higher volatility.
Geopolitical developments, such as trade policy shifts or regulatory reforms, add another layer of complexity. For example, increased emphasis on environmental, social, and governance (ESG) investing has spurred growth in green technology sectors, where annualized returns may range from 6% to 14%. Staying attuned to these trends enables investors to position portfolios for resilient compounding in a changing world.
Diversification Strategies Amplifying Compound Growth
Diversification—spreading investments across asset classes, sectors, and geographies—remains a cornerstone for enhancing the reliability of compounding. Allocating across stocks, bonds, commodities, and real estate can reduce the impact of adverse events in any single area. For example, a portfolio split 60% equities and 40% bonds has historically delivered smoother compounded returns, with annualized volatility around 10% to 12%, compared to over 15% for all-equity portfolios.
Geographic diversification, such as including both U.S. and emerging market equities, can capture growth from different economic cycles. Alternative investments, like private equity and infrastructure, often provide returns in the 7% to 12% range, with lower correlation to public markets. However, these alternatives may have higher fees—often 1% to 2% annually—and limited liquidity, requiring careful consideration. Regular portfolio reviews and rebalancing, typically done annually or semi-annually, help ensure that allocations remain aligned with long-term objectives and risk tolerance, supporting sustainable compounded wealth.
Worked Example: The Power of Compounding
Suppose an investor contributes $5,000 annually to a portfolio earning an average annual return of 7%. Over 20 years, the total contributions would be $100,000. Using the compound interest formula for regular contributions, the portfolio would grow to approximately $204,000—more than doubling the total invested. This outcome highlights how consistent investing and compounding returns can accelerate wealth accumulation, even with moderate annual contributions.
References
- https://www.investor.gov/financial-tools-calculators/calculators/compound-interest-calculator
- https://www.finra.org/investors/investing/investing-basics/asset-allocation-diversification
- https://www.investor.gov/introduction-investing/investing-basics/glossary/diversification
- https://www.investor.gov/introduction-investing/investing-basics/glossary/asset-allocation
- https://www.investor.gov/introduction-investing/investing-basics/how-stock-markets-work
- https://www.federalreserve.gov/monetarypolicy.htm






