
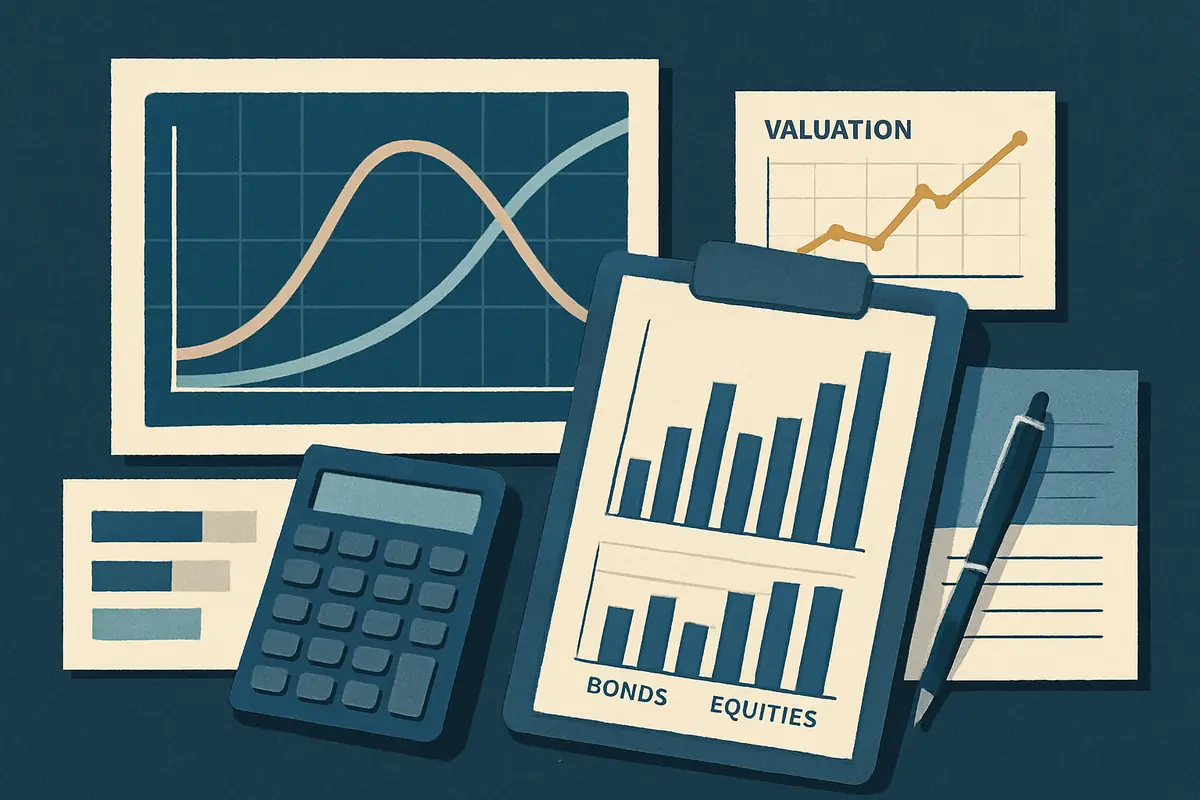
In today’s financial markets, capital allocation decisions are shaped by a multitude of evolving variables—interest rates that have climbed by 2–4 percentage points in recent years, persistent inflation that can range from 3% to 8% annually, and volatility spikes that can double average daily price swings. At the same time, the infrastructure behind investment analysis is becoming more complex and costly. As new analytical tools and data sources multiply, their cumulative expenses can easily surpass $500,000 per year for mid-sized institutional investors. This article explores how the rising costs of investment analysis can erode the value it creates, and offers practical strategies for institutional investors to manage these hidden expenses without sacrificing decision quality.
Market Context: Rising Costs Amid Complex Investment Environments
The current macroeconomic environment intensifies the challenges of investment analysis. Elevated interest rates—now commonly ranging from 4% to 6% for benchmark government debt—have compressed traditional valuation multiples, while inflation rates above 4% introduce additional uncertainty across equities, bonds, and alternatives. Regulatory compliance costs have also increased, with some firms reporting annual compliance budget growth of 8–12% over the last three years. Simultaneously, the proliferation of alternative data sources—such as satellite imagery, social media sentiment, and real-time transaction data—has pushed research budgets higher, with institutional research teams seeing operational expenses rise by 10–15% year-over-year.
Technological advances have made data more accessible, but integrating and interpreting these vast streams requires expensive infrastructure. For example, a typical mid-sized fund may spend $150,000–$300,000 annually on cloud computing and data warehousing alone. As data volumes grow, the cost and complexity of processing, cleaning, and analyzing information can quickly outpace the incremental value added to investment decisions. Portfolio managers must therefore ask: When does the next dollar spent on analysis stop delivering meaningful improvements to portfolio outcomes?
The Investor’s Dilemma: The Point Where Deeper Analysis Becomes Counterproductive
Investors routinely weigh the marginal benefits of additional analysis against its direct and indirect costs. While more granular research can reveal overlooked risks or value, it can also lead to decision paralysis or overfitting—where models are tailored to past data that may not predict future outcomes. Overfitting refers to the use of excessively complex models that capture random patterns in historical data rather than true underlying relationships.
Institutional frameworks often demand rigorous risk assessments and scenario analysis, but each additional layer of data or modeling adds to costs. For mid-sized firms with research budgets of $1 million to $3 million annually, allocating another $200,000 to $400,000 for niche data sets may only yield a marginal increase in forecast accuracy—sometimes less than 0.5% improvement in predictive power. During periods of market stress, such as a 20% drawdown in equities or a 200-basis point interest rate spike, rapid decisions are required, and excessive analytical complexity can slow response times, increasing opportunity costs.
Scenario: A Hedge Fund Grapples with High Data Subscription Fees
A mid-tier hedge fund faced a decision: maintain subscriptions to five premium data feeds at a combined annual cost of $900,000, or consolidate to three sources for $550,000. Management analyzed six months of performance data and found that the incremental alpha—outperformance relative to a benchmark—attributable to the two most expensive feeds was less than 0.2% annually. By consolidating, the fund reduced research costs by $350,000 per year without a statistically significant drop in portfolio returns, freeing capital for other uses.
Data and Scenario Analysis: Quantifying the Cost-Benefit Trade-Off
Quantitative frameworks often assess cost-benefit trade-offs using metrics like the Information Ratio, which measures excess return per unit of risk. For example, initial investments in analytics—such as $100,000 for a basic data platform—can improve portfolio performance by 1–2% annually through better risk management and opportunity identification. However, as spending increases, the cost for each additional basis point (0.01%) of improvement can rise sharply. For instance, increasing research spend from $500,000 to $1 million might only yield an extra 0.3% in annual return, pushing the cost per incremental basis point to over $16,000.
High-frequency trading strategies, which rely on rapidly updated data, can also incur substantial turnover costs. Transaction fees, bid-ask spreads, and market impact costs can erode 2–4% of gross returns annually if portfolio turnover exceeds 200%. Therefore, investors must account for these indirect expenses as part of the true cost of analysis-driven strategies.
Worked Example: Calculating the Marginal Benefit of Additional Analysis
Suppose an investment firm spends $400,000 per year on core data and research, generating an average annual return of 7%. They consider adding a premium analytics package costing an extra $200,000 per year. Backtesting suggests the new tool could improve returns by 0.4% annually, raising total expected return to 7.4%.
Step 1: Calculate the cost per basis point (0.01%) improvement.
0.4% improvement = 40 basis points.
Cost per basis point = $200,000 / 40 = $5,000 per basis point.
Step 2: Consider opportunity cost. Could $200,000 generate more than 0.4% return if invested elsewhere? If the firm’s hurdle rate is 5%, $200,000 would need to generate at least $10,000 in incremental profit elsewhere.
Step 3: Factor in indirect costs, such as increased trading fees (e.g., 0.5% of assets under management if turnover rises).
Conclusion: If the tool’s benefits outweigh both direct and indirect costs, it may be justified; otherwise, the investment may not be efficient.
Warning Signs: Recognizing When Analysis Costs Outpace Benefits
Several warning signs signal that analysis costs are exceeding their value. One is an expanding gap between improvements in forecast accuracy and increases in analytics budgets—if a 15% budget hike yields only a 1% gain in predictive accuracy, efficiency may be declining. Analyst fatigue, seen in high turnover or declining productivity, can result from constant demands for more granular data and real-time updates, reducing the quality of discretionary judgment.
Overreliance on complex models—such as those using hundreds of variables or millions of data points—can lead to groupthink and a false sense of precision. This is especially risky in volatile markets, where models trained on historical data may fail to anticipate new structural changes. A culture focused on exhaustive data collection at the expense of critical thinking can inadvertently amplify systemic risks, as herd behavior is reinforced by expensive but imperfect signals.
"Warning Sign" Example: Model Overfitting in Volatile Markets
During a period of sharp market reversal, several quantitative funds experienced losses after their models, trained on expanded datasets costing over $250,000 per year, captured short-lived correlations rather than persistent drivers of returns. The attempt to continuously improve model accuracy with more expensive data led to overfitting, resulting in losses of 4–7% during the regime shift.
Pros and Cons: Weighing Analytical Depth Versus Expense
Advantages of Extensive Analysis
- Improved identification of nuanced risks and opportunities, potentially increasing risk-adjusted returns by 1–3% per year.
- Greater confidence in investment theses supported by multiple data points, reducing estimation errors by up to 20% in complex scenarios.
- Ability to perform scenario stress testing, such as Monte Carlo simulations (which model thousands of possible outcomes), aligned with evolving market conditions.
Risks Associated with Excessive Analytical Costs
- Diminishing marginal returns, with research expenditures rising by 20–30% but incremental performance gains flattening after a certain point.
- Increased complexity can delay decision-making, sometimes causing missed opportunities during market moves that last only hours or days.
- Potential for overfitting models, leading to misleading signals and higher drawdowns during market shifts.
- Higher indirect costs, including transaction fees that can exceed 1% of portfolio value annually due to more frequent trades.
Practical Implications: Navigating Trade-Offs in Portfolio Construction
Integrating cost awareness into analytical frameworks is essential for portfolio managers. Rather than indiscriminately expanding data acquisition, firms benefit from establishing calibrated thresholds—such as capping research spend at 5–10% of management fees or limiting the number of premium data subscriptions to those with a proven track record of adding alpha. Historical cost-benefit analysis, such as reviewing three-year rolling performance versus research spend, can help prioritize high-impact analyses while containing costs.
Flexibility is also crucial. In stable markets, leaner analysis—focused on core financial metrics and macroeconomic indicators—may suffice, reducing costs by up to 30% compared to volatile periods. During market dislocations, temporarily increasing research budgets by 10–20% may be justified if the opportunity set expands. This dynamic approach helps align analytical depth with prevailing risk-reward profiles.
Scenario: Asset Manager Adjusts Analytical Scope Across Market Cycles
An asset manager adopted a dynamic budgeting process, allocating an additional $100,000–$200,000 toward proprietary research during quarters when volatility indexes spiked above 25. During stable periods, they reduced research spending by 15%, focusing on core metrics and passive monitoring. This approach allowed for cost control without sacrificing responsiveness to changing market conditions.
Strategic Reflection: Building Sustainable Investment Analysis Practices
Excessive spending on investment analysis—often exceeding 10% of total operating expenses—can erode net returns, even when gross alpha generation remains steady. Institutional investors should develop disciplined frameworks that emphasize the quality and relevance of information relative to its cost. For example, prioritizing data sources that have historically contributed at least 0.5% annual alpha can help justify their expense.
Continuous scrutiny of analytical workflows, informed by lessons from prior market cycles and close monitoring of technological trends, is key. Technologies such as open-source analytics platforms and machine learning tools can reduce costs by 20–40% compared to legacy systems. Ultimately, optimal resource allocation balances precision with agility, adapting to economic conditions rather than pursuing exhaustive detail at any cost.
Evaluating the True Cost of Investment Analysis Tools
When assessing investment analysis tools, it’s important to look beyond the sticker price and consider the full range of associated costs. Many platforms offer tiered subscriptions, with basic packages starting around $50–$200 per month and premium analytics reaching $1,000–$3,000 per month. While comprehensive data and sophisticated algorithms can be attractive, not all features provide proportional value—individual investors managing portfolios under $250,000 may find that advanced tools add little incremental benefit relative to their cost.
Hidden fees can further inflate the true cost of analysis. Some platforms charge $100–$500 per month for real-time alerts, $50–$150 per export for customized reports, or integration fees with portfolio management systems that add 10–15% to annual costs. These charges may not be obvious at sign-up but can add thousands per year. For example, a trader exporting daily transaction data for tax purposes might incur $3,000–$5,000 in additional annual fees. Scrutinizing terms of service and comparing transparent pricing models is essential to avoid unexpected expenses.
Time investment is another significant, often overlooked cost. Advanced platforms may require 20–50 hours of initial training and ongoing weekly maintenance of 2–5 hours to stay current. For retail investors balancing multiple responsibilities, investing excessive hours in tool mastery can detract from other activities, such as market research or portfolio rebalancing. Choosing tools with intuitive interfaces and robust customer support can reduce these time costs by 30–50%.
Opportunity cost is also critical. Capital allocated to expensive subscriptions—say, $300 per month or $3,600 per year—could instead be invested in diversified assets. For instance, redirecting $3,600 annually into an index fund with a 6% average annual return could yield nearly $20,000 after 10 years, assuming compounding. Cognitive opportunity cost also matters: time spent navigating complex software could be used to strengthen core investing principles, which often drive long-term results.
Technology advancements have democratized access to quality financial information. Open-source platforms, community forums, and free economic datasets can substitute for paid services, with some offering 80–90% of the functionality of premium tools. Algorithmic trading bots using public APIs can be set up for under $1,000 per year, though they require technical proficiency and discipline to manage effectively. These lower-cost solutions can be attractive alternatives for investors willing to invest time in learning.
Risk management tools—such as Monte Carlo simulations, which model thousands of potential outcomes—are available in both premium and free versions. While advanced tools may offer more scenario depth, their complexity does not guarantee better performance. In fact, simpler diversification strategies, such as spreading investments across 10–20 uncorrelated assets, can sometimes outperform complex quantitative models, especially when model assumptions break down in volatile markets.
Behavioral considerations are also relevant. High-cost platforms often feature visually engaging dashboards and real-time feedback, which can encourage overtrading or short-termism. Investors must be cautious: excessive engagement driven by tool design can increase trading frequency and transaction costs, eroding long-term returns. For example, increasing trade frequency from 10 to 50 trades per month can raise annual transaction costs by $1,000–$2,500, depending on broker fees.
Balancing Cost Against Benefit: Making Informed Choices
Balancing Cost and Value in Investment Analysis Tools
Investors regularly encounter premium analysis tools with monthly fees from $500 to $3,000. While these promise enhanced insights and advanced analytics, the key question is whether the incremental value justifies the added cost. It’s essential to assess not only the sticker price, but also how the tool fits your investment strategy, portfolio size, and workflow. For example, a retail investor managing $50,000 may find that a $2,400 annual subscription represents nearly 5% of their assets—potentially outweighing any incremental return benefit—while a professional manager overseeing $100 million can justify the cost if it leads to even a 0.1% improvement in performance.
Diminishing returns are a central consideration. As investment in tools increases, the marginal benefit of each new feature or dataset falls. For example, the first $500 per month spent on analytics might improve performance by 1%, but an additional $1,000 per month may only yield another 0.2%. This is similar to overfitting in data science: beyond a certain point, additional complexity can obscure rather than clarify investment decisions.
Integration costs also matter. If a tool’s interface is difficult to use or its data is hard to combine with existing systems, the resulting inefficiencies can offset its benefits. Some platforms impose long-term contracts or cancellation penalties of up to 50% of remaining fees, which can limit flexibility as market conditions or investment objectives change.
Real-world examples illustrate the pitfalls of excessive spending. An investor subscribing to four premium data providers at $1,000 each per month ($48,000 per year) but lacking time or expertise to synthesize the information may experience decision paralysis or default to surface-level analysis. Conversely, investors who use targeted, lower-cost resources often achieve competitive results by focusing on core metrics relevant to their strategy.
A practical approach is to adopt a tiered strategy: begin with essential services—often costing $50–$200 per month—and scale up only when measurable benefits justify additional expense. Supplementing free or low-cost platforms with selective premium features, accessed on-demand, can maintain cost control while delivering valuable insights.
Collaboration and knowledge sharing within investor communities can further reduce reliance on costly tools. Online forums and social trading networks enable sharing of research and analysis at minimal cost, often matching the depth of paid resources for many investment styles.
Evaluating Alternative Approaches Without Sacrificing Quality
The investment analysis landscape continues to evolve, with technology making robust tools available to a broader audience. Many free or affordable platforms now offer charting, screening, and forecasting capabilities that meet the needs of most individual investors. These tools typically feature user-friendly interfaces, reducing the learning curve to 5–10 hours compared to 30–50 hours for professional suites.
In addition to digital tools, investors can develop their own frameworks using fundamental analysis techniques such as discounted cash flow (DCF) models—which estimate the present value of expected future cash flows—and comparative valuation methods based on price-to-earnings or price-to-book ratios. Publicly available financial statements and economic data can support these approaches at little or no cost, enabling investors to maintain control over their process and deepen their understanding of businesses—an advantage during volatile markets when intuition informed by solid analysis prevails.






