
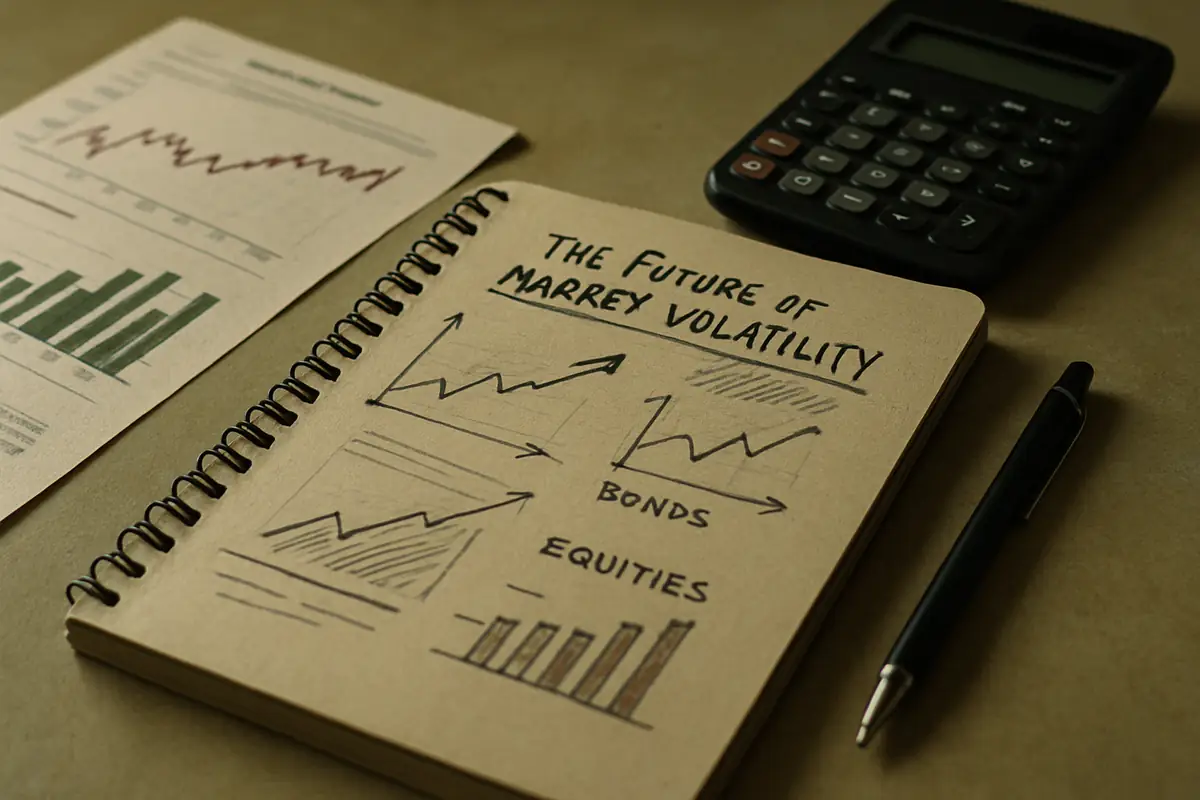
Market volatility—defined as the rate and magnitude of price fluctuations in financial markets—reflects the interplay of interest rates, liquidity, and investor sentiment. In the past decade, volatility spikes of 20% or more in major equity indexes have accompanied shifts in central bank policy and global risk events. Understanding the drivers behind these moves requires a nuanced approach that avoids common analytical pitfalls, enabling investors to respond with discipline rather than react to noise.
Interest Rates and Their Complex Influence on Volatility Patterns
It is often assumed that rising interest rates always lead to higher market volatility. While periods of interest rate hikes—such as the 2015–2018 Federal Reserve cycle—did coincide with volatility increases of 15–25% in some asset classes, this relationship is not absolute. The effect depends on factors like central bank communications, known as forward guidance, which can either calm or unsettle markets. Forward guidance refers to how central banks signal future policy intentions, helping investors anticipate changes and adjust portfolios accordingly.
Volatility is also shaped by the difference between nominal rates (the stated rate before inflation) and real yields (the rate after accounting for inflation). For example, if nominal rates rise from 2% to 4% while inflation expectations increase from 1% to 3%, the real yield change is minimal, potentially muting volatility. Conversely, a sharp rise in real yields can trigger rapid repricing. Recognizing these nuances helps investors avoid misjudging risk and making portfolio shifts that could cost 5–10% in missed returns over a year.
To correct this error, investors should analyze volatility in relation to macro-financial conditions, including risk premiums (the extra return demanded for taking risk), overall liquidity, and changes in market structure. For instance, a 0.5% rate hike during a period of abundant liquidity may cause less than a 10% spike in volatility, while the same hike under tight liquidity conditions could double volatility levels. Integrating these variables into analysis allows for more precise risk management.
Understanding Liquidity: Why Market Depth Fluctuates
Another common mistake is assuming that liquidity—the ability to buy or sell assets without causing major price changes—remains stable. In reality, liquidity can evaporate quickly during shocks, as seen during March 2020 when bid-ask spreads in U.S. Treasuries widened by 300% within days. Passive investing (where funds track indexes rather than pick stocks) and algorithmic trading (where computers execute trades based on set rules) now account for over 60% of daily trading volume in some markets, altering how liquidity behaves.
To address this misconception, treat liquidity as dynamic. Regulatory changes, such as increased capital requirements for banks, can reduce market-making capacity by 20–40% in stressed periods. Incorporating scenario analysis—testing how portfolios would perform if liquidity dropped by half—helps investors anticipate potential losses. For example, a portfolio expected to lose 5% in a normal correction could face 10–15% drawdowns if liquidity dries up. Stress-testing under different liquidity regimes is essential to avoid unexpected capital erosion.
Investor Behavior: Beyond Simple Risk Aversion
Investor reactions to volatility often go beyond risk aversion (the preference to avoid losses). Behavioral patterns such as herding (copying others' trades), overreaction (excessive response to news), and reflexivity (feedback loops where price moves influence fundamentals) can amplify volatility. For instance, during the 2020 pandemic selloff, equity outflows exceeded $60 billion in a single month, reflecting both fear and herd dynamics.
Correcting for behavioral biases involves combining insights from behavioral finance—the study of how psychology affects investment decisions—with quantitative risk assessment. For example, if a stock index falls 10% in a week but economic fundamentals remain unchanged, distinguishing between panic selling and justified repricing helps avoid locking in losses. Recognizing crowd-driven moves enables investors to balance risk exposure and recovery potential more effectively.
Advantages of Incorporating Behavioral Context in Volatility Analysis
- Improves timing by distinguishing between fundamental shifts and sentiment-driven noise.
- Enhances risk management by anticipating sharp, non-linear reactions—such as 5–15% single-day swings.
- Supports diversification by identifying mispricings caused by sentiment extremes.
Challenges and Limitations
- Behavioral models are hard to quantify and may not fit all environments.
- Investor psychology varies with market cycles and regions.
- Reliance on past behavioral patterns risks overfitting and missing new dynamics.
The Overlooked Role of Valuation Cycles in Volatility Regimes
Valuation—the process of determining the fair value of assets—plays a crucial role in shaping volatility. When valuations are high, such as price-to-earnings ratios exceeding 25–30 in equities, risk premiums compress and markets become more sensitive to negative surprises. A 10% correction can occur swiftly if catalysts emerge, as seen in late 2021. In contrast, undervalued markets may show low realized volatility but harbor hidden risks that can erupt unexpectedly.
For example, suppose an investor buys a stock at a price-to-earnings ratio (P/E) of 30 when the long-term average is 16–18. If earnings disappoint by 10%, the stock could drop not just by 10%, but by 20–25% as the P/E multiple contracts toward the mean. Ignoring these valuation cycles leads to mispricing the probability of future returns and underestimating the risk of sharp corrections.
Recognizing Structural Shifts in Volatility Drivers
Relying solely on recent historical data—a pitfall known as "data myopia"—ignores how structural changes reshape volatility. Over the past 20 years, globalization, technological innovation, and changing regulatory regimes have altered correlations between asset classes. For instance, the correlation between stocks and bonds, which averaged -0.3 to -0.5 from 2000 to 2020, can shift to positive territory during inflation shocks, reducing diversification benefits.
Scenario analysis—testing how portfolios respond to different macroeconomic and geopolitical events—can reveal vulnerabilities not visible in backward-looking models. For example, a scenario where global supply chains are disrupted could increase commodity price volatility by 30–40%, affecting assets previously considered stable. Sensitivity testing against emerging risks builds a more resilient framework for navigating future uncertainty.
Risk Premium Compression and Volatility Expectations
Risk premium compression—when the extra return for taking risk shrinks to multi-year lows, such as credit spreads narrowing to 1–2%—can lull investors into underestimating volatility. Periods of low-risk premiums, often below 3% for investment-grade bonds, have historically preceded sharp re-pricings when unexpected events occur. For example, in 2018, compressed risk premiums reversed within weeks, leading to 10–15% equity drawdowns.
Where readers should be careful
Neglecting risk premium dynamics can result in underestimating potential losses during abrupt shifts in market sentiment or policy, with drawdowns exceeding 15% not uncommon in compressed environments.
Balancing Volatility Management with Return Objectives
Investors face the challenge of reducing volatility without sacrificing returns. For example, shifting 20% of a portfolio from equities to cash during a volatility spike may reduce short-term risk by 5–7%, but could also lower annual returns by 1–2% if markets recover. Overreacting to temporary volatility can lead to opportunity costs, while ignoring regime changes risks larger losses.
Consider this worked example: An investor holds a $100,000 portfolio split 60% equities ($60,000) and 40% bonds ($40,000). During a volatility spike, equities drop 15% and bonds rise 2%. The loss on equities is $9,000 (15% of $60,000), while the gain on bonds is $800 (2% of $40,000), making the total portfolio loss $8,200. If the investor had shifted $20,000 from equities to bonds before the drop, the loss on equities would be $6,000 (15% of $40,000), and the gain on bonds would be $1,200 (2% of $60,000), resulting in a total loss of $4,800. This demonstrates how dynamic allocation can reduce losses, but if markets rebound 20% after the drop, the lower equity allocation could result in missed gains of $4,000.
A robust framework combines macroeconomic monitoring (like inflation trends, which have ranged from 1% to 9% in developed economies over the past decade), dynamic liquidity assessment, valuation analysis, and behavioral feedback. This layered approach enables nuanced adjustments rather than blanket de-risking.
Benefits of a Multilayered Volatility Framework
- Captures multiple drivers for a more complete risk picture.
- Improves timing for tactical shifts, potentially reducing drawdowns by 3–5%.
- Increases resilience against shocks, such as 20% market corrections.
Implementation Challenges
- Requires access to diverse data and analytics.
- Complexity may deter investors with under $100,000 in assets.
- Risk of over-analysis leading to indecision during fast-moving markets.
Scenario Analysis: Preparing for a Range of Volatility Outcomes
Scenario-based stress testing is a powerful but underused tool. By modeling 4–6 distinct scenarios—such as rapid rate hikes, geopolitical escalations, or commodity shocks—investors can estimate volatility variations of 15–30% across plausible futures. For example, a scenario combining a 2% rate hike with a 20% oil price spike may produce double the volatility of a gradual tightening scenario.
Stress testing across multiple asset classes is critical: cross-asset correlation shifts can turn a diversified portfolio into a concentrated risk bet. For instance, if equities and bonds both decline during an inflation shock, portfolio losses can exceed 20% even with traditional diversification. Institutional investors increasingly use scenario analysis to design hedging strategies that align with real-world risks, rather than relying on best- or worst-case extremes.
Limitations of Simplistic Volatility Metrics
Headline metrics like the VIX (which measures expected S&P 500 volatility over the next 30 days) provide useful signals, but fail to capture the full risk picture. For example, VIX values can remain below 20 during periods when sector-specific volatility (such as in technology stocks) exceeds 30–40%. Overreliance on a single metric ignores other risk dimensions such as skewness (asymmetry of returns), kurtosis (frequency of extreme moves), and the difference between realized (actual) versus implied (expected) volatility.
Comprehensive risk frameworks layer in options-market signals (such as put-call ratios), fundamental news-flow analysis (tracking earnings revisions or macro surprises), and microstructure factors (like order book depth). This multi-pronged approach helps avoid blind spots that can result in 10% or greater losses during complex market episodes.
Where readers should be careful
Relying on a single indicator for volatility can mask risks, leading to insufficient hedging or delayed responses during sharp market moves.
The Behavioral Trap of Chasing Low Volatility Trends
Extended periods of subdued volatility—such as VIX readings below 15 for several quarters—can breed investor complacency. This often leads to higher leverage (borrowing to invest) or reduced hedging, increasing vulnerability to abrupt volatility spikes. For example, portfolios with leverage ratios above 1.5x can suffer double the drawdown in a sudden correction compared to unleveraged portfolios.
Breaking this pattern requires institutional discipline, regular scenario reviews, and recognition that volatility cycles are inevitable. Historical data shows that periods of low volatility lasting 12–24 months are often followed by spikes exceeding 30%, tied to fundamental resets in risk pricing.
Why Proactive Preparation Matters
- Reduces impact from sudden volatility increases of 10–20%.
- Enables timely capital deployment during downturns, capturing recovery gains.
- Aligns expectations with cycles—periods of calm rarely persist beyond 2–3 years without interruption.
Potential Downsides
- Proactive hedging can reduce returns by 0.5–1% annually during calm phases.
- Maintaining cash or hedge positions incurs opportunity costs.
- Managing drawdowns can be psychologically challenging during choppy markets.
Reflecting on the Evolution of Market Volatility
As financial markets adapt to new monetary policies, shifting liquidity, geopolitical disruptions, and evolving investor behaviors, predicting volatility remains complex. Mistakes often stem from oversimplifying this complexity or focusing too narrowly on recent data. For example, models that ignore structural changes may underestimate the risk of 10–20% drawdowns during regime shifts.
The prudent approach is to acknowledge model limitations and maintain analytical humility. Continuously updating frameworks with empirical observations and scenario foresight helps investors adapt to new volatility regimes and avoid the pitfalls of static thinking.
Emerging Technologies and Their Influence on Volatility
Technological advances such as artificial intelligence (AI), blockchain, and high-frequency trading (HFT) are reshaping market mechanics. AI-driven trading algorithms can process millions of data points per second, executing trades within milliseconds. While this can tighten bid-ask spreads and improve price efficiency, it also introduces risks of flash crashes—sudden price drops of 5% or more that rebound quickly, as seen in the 2010 and 2015 episodes.
Blockchain technology, which underpins decentralized finance (DeFi), enables trading of tokenized assets around the clock. This has expanded the range of tradable instruments by 20–30% in some markets and altered liquidity patterns. The diversification offered by DeFi can dampen traditional volatility, but also creates new risks as protocols are tested by real-world events. As DeFi adoption grows, liquidity fragmentation could lead to isolated volatility spikes exceeding 50% in some tokens.
Regulators are responding by increasing real-time market monitoring and requiring transparency in algorithmic trading. Investors should monitor how AI models interpret economic data and how DeFi protocols manage risk, as these factors increasingly influence both short-term volatility and long-term stability.
Geopolitical Tensions as a Volatility Catalyst
Geopolitical events—such as trade wars, sanctions, and military conflicts—are among the most potent volatility drivers. In the past five years, major geopolitical shocks have triggered 10–30% swings in equity and commodity markets within weeks. Supply chain disruptions from trade barriers or sanctions can cause sharp price adjustments not just in affected sectors but across the global market due to interconnectedness.
Emerging markets are particularly sensitive, with currency swings of 5–15% and capital outflows exceeding $20 billion in some crises. Sovereign debt and political instability amplify these effects, making risk assessment and diversification critical for international investors. Hedging strategies—such as currency options or country-specific ETFs—can help mitigate losses during periods of heightened geopolitical uncertainty.
Climate Change Risks and Market Volatility
Climate change introduces both physical and transition risks to financial markets. Physical risks—such as hurricanes, floods, and wildfires—have caused insured losses exceeding $100 billion per year in recent years, impacting company earnings and asset valuations. Transition risks arise from regulatory changes, such as carbon pricing or emissions standards, which can alter industry profitability and increase volatility in affected sectors.
Financial institutions are integrating environmental risk into credit and investment decisions. Firms with strong environmental governance may benefit from lower risk premiums—by 0.5–1%—while those lagging on climate adaptation could face higher borrowing costs or restricted access to capital. As climate-related disclosures become more widespread, investors will have better tools to assess these risks, but the long-term and uncertain nature of climate impacts means volatility could rise as markets adjust expectations.
Monetary Policy Shifts and Volatility Dynamics
Central banks set monetary policy through tools like interest rate adjustments and quantitative easing (QE, large-scale asset purchases). In the post-pandemic period, interest rates in developed economies have risen from near 0% to 4–5% within two years, triggering repricing across bonds and equities. A 1% rise in rates can reduce bond prices by 7–10% depending on duration (a measure of interest rate sensitivity), and equity valuations can fall by 10–15% as discount rates rise.
Unconventional policies like QE can compress volatility in the short term but make exit strategies challenging. For example, when central banks signal an end to QE, liquidity can tighten rapidly, causing volatility to spike by 50% or more in sensitive markets. Monitoring central bank statements and macroeconomic data is essential for anticipating periods of heightened volatility related to policy shifts.
Strategies for Navigating Future Volatility
To manage the diverse drivers of volatility, investors should build robust, adaptable strategies. Diversification—spreading investments across asset classes, sectors, and regions—remains foundational, typically reducing portfolio volatility by 20–30% compared to concentrated bets. Including alternative assets such as real estate or private equity can provide additional buffers during traditional market downturns.
Active risk management, such as dynamic asset allocation (periodically adjusting the mix of assets), allows portfolios to respond to new information. Tactical use of options (contracts granting the right to buy or sell at a set price) can limit downside without capping upside potential. Maintaining liquidity—keeping 5–10% of assets in cash or equivalents—enables investors to take advantage of dislocations rather than being forced into sales during stress.
Continuous education on emerging risks and regular scenario reviews enhance decision-making under uncertainty. By combining these practical approaches, investors can position portfolios to withstand and capitalize on future volatility challenges, aiming for both resilience and long-term growth.
References
- https://www.investor.gov/introduction-investing/investing-basics/glossary/volatility
- https://www.investor.gov/introduction-investing/investing-basics/how-stock-markets-work
- https://www.investor.gov/introduction-investing/investing-basics/glossary/bond
- https://www.investor.gov/introduction-investing/investing-basics/glossary/dividend
- https://www.bls.gov/cpi/






