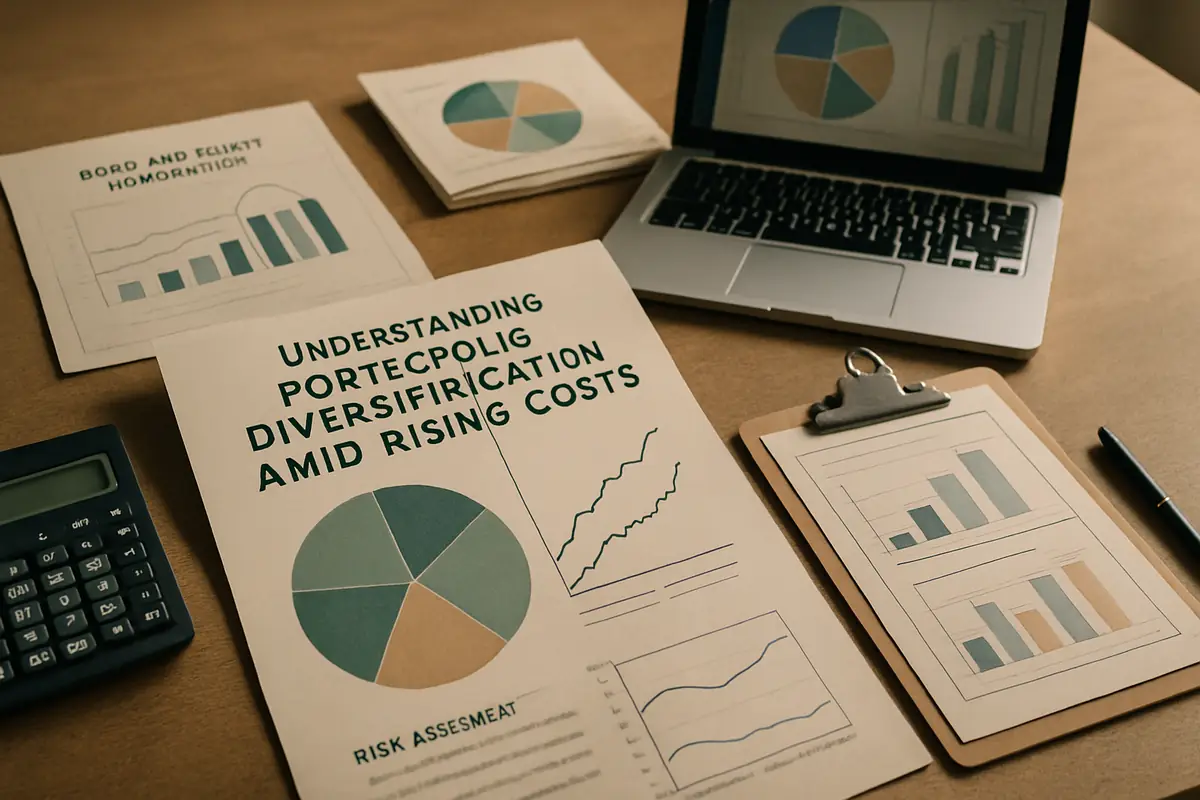
In a climate where investment costs have climbed—brokerage commissions, fund expense ratios, and capital gains taxes all seeing increases over the past decade—households face new challenges in balancing risk reduction and cost efficiency through portfolio diversification. Let’s examine how two families navigate these trade-offs, revealing where diversification continues to add value and where mounting costs can quietly erode returns.
Assessing Portfolio Diversification as Costs Increase
Portfolio diversification, the practice of spreading investments across different assets or asset classes to reduce risk, remains a cornerstone of sound investing. By allocating among equities, bonds, real estate, and other vehicles, investors typically experience less volatility—often 10% to 20% lower than holding a single asset class like domestic stocks alone. However, diversification involves multiple transactions, ongoing management costs, and periodic taxable events. When these costs rise—such as brokerage commissions increasing from $5 to $10 per trade, or average mutual fund expense ratios growing from 0.5% to 1%—the net benefits of diversification are reduced. In taxable accounts, more frequent rebalancing can trigger short-term capital gains taxes, which in the U.S. may range from 22% to 37% depending on income. Investors must now weigh whether the potential risk reduction is worth these incremental costs, especially when annual returns in broad equity markets have sometimes hovered between 4% and 7% in recent years.
Retail investors with portfolios under $500,000 are particularly sensitive to these dynamics. For example, a portfolio with 40 trades per year at $8 per trade incurs $320 in direct commissions alone, not counting management fees and taxes. As a result, evaluating the effectiveness of diversification today requires a careful cost-benefit analysis, not just an assumption that spreading risk always pays off.
Scenario One: The Johnson Family Maintains Broad Diversification Despite Higher Costs
Household Profile: The Johnson Family
The Johnsons manage a $200,000 portfolio diversified across domestic equities (40%), international equities (30%), bonds (20%), and real estate investment trusts (REITs) (10%). They rebalance every quarter to maintain these weights. Their brokerage charges $7 per trade, their mutual funds carry an average expense ratio (the annual fee charged by a fund, expressed as a percentage of assets) of 0.75%, and recent tax changes have raised their short-term capital gains tax rate to 32%. In the past year, they made 32 trades, paying $224 in commissions, plus $1,500 in management fees, and realized $2,400 in capital gains taxes from rebalancing.
For the Johnsons, risk control is paramount. Quarterly rebalancing helps avoid concentration in any one asset class, especially as market values fluctuate. They accept that costs will trim returns, but prioritize reducing volatility—which for their portfolio, has averaged about 11% over the past five years, compared to 16% for the S&P 500.
Let’s work through a concrete example: Suppose the Johnsons’ portfolio earns a gross return of 6% ($12,000 on $200,000) in a given year. Subtracting $224 in commissions, $1,500 in expense ratios, and $2,400 in capital gains taxes, their net return is $7,876. This equates to a net return of 3.9%—a drag of 2.1 percentage points compared to the gross return, illustrating how costs can consume a third or more of annual gains in a flat or modestly rising market.
Scenario Two: The Martin Family Concentrates Holdings to Minimize Costs
Household Profile: The Martin Family
The Martins hold a $150,000 portfolio, primarily in large-cap U.S. equities (80%) and municipal bonds (20%). Municipal bonds are debt securities issued by state or local governments, often providing tax-exempt interest income. The Martins rebalance only once per year or when allocations drift by more than 10%. Their broker charges $4 per trade, and their index funds have a low average expense ratio of 0.20%. By focusing on tax-exempt municipal bonds, their effective tax bill on bond income is near zero, compared to taxable bond interest rates that can be taxed at up to 37% in high brackets.
With this approach, the Martins made just 8 trades last year, incurring $32 in commissions and $300 in fund expenses, with no capital gains taxes due to minimal trading and tax-efficient bond holdings. They accept higher volatility—typically 13% to 14% annualized, given their heavy equity tilt—but preserve more of their gross returns.
Modeling their outcomes: On a 7% gross return ($10,500 on $150,000), after $32 in commissions and $300 in expenses, their net return is $10,168, or 6.8%. The cost drag is just 0.2 percentage points, allowing most of the market return to compound over time, though with greater exposure to equity market swings.
Comparing Key Cost Factors for Diversification
| Factor | Johnsons’ Portfolio Impact | Martins’ Portfolio Impact |
|---|---|---|
| Diversification Benefits | High; volatility reduced by 15–20% vs. S&P 500 alone, limiting drawdowns during market corrections. | Lower; volatility about 8% higher than a balanced portfolio, with greater impact from U.S. equity downturns. |
| Liquidity Flexibility Costs | Moderate; 32 trades/year create $224 in commissions and frequent taxable events. | Low; 8 trades/year keeps frictional costs minimal, but limits ability to shift allocations quickly. |
| Tax Efficiency Strategies Used | Limited; occasional tax-loss harvesting, but frequent rebalancing triggers short-term gains taxed at 32%. | High; municipal bonds generate tax-exempt income, reducing overall tax burden by several hundred dollars annually. |
Strengths and Weaknesses of Diversification When Costs Rise
Where Diversification Remains Effective Despite Higher Costs
- Reduces unsystematic risk by balancing exposure across sectors, regions, and asset types—often lowering portfolio volatility by 10–20%.
- Supports steadier returns, making long-term planning more reliable, especially during market downturns when concentrated portfolios can lose 30% or more.
- Enables tactical reallocation to pursue growth or defensive opportunities without wholesale portfolio changes.
Where Higher Costs Undermine Diversification
- Transaction fees, even as low as $5–$10 per trade, can add up to hundreds per year for active rebalancers, reducing net returns by 1–2% annually.
- Frequent trading generates short-term capital gains taxed at rates up to 37%, eroding after-tax profits, especially in taxable accounts.
- Diversified mutual funds often have expense ratios of 0.5–1.2%, higher than concentrated index ETFs at 0.03–0.20%.
- Complex portfolios require more oversight, increasing the risk of missed rebalances or administrative errors, which can further impact returns.
Timeline: How Diversification Costs Have Shifted (2015–2023)
From 2015 to 2023, the investment landscape has seen notable changes. Average brokerage commissions dropped from $8 to near zero at some discount brokers, but many full-service platforms still charge $5–$10 per trade. Mutual fund expense ratios have remained steady or slightly increased for active funds, hovering between 0.6% and 1.2%, while index ETFs have dropped below 0.1% in some cases. Capital gains tax rates on short-term gains have remained high, typically 22–37%. Bid-ask spreads on less liquid assets, such as municipal bonds or international equities, have widened by 20–30% during periods of market stress, increasing trading costs. These trends mean that while some explicit costs have fallen, others—especially taxes and active management fees—continue to challenge the net benefits of diversification.
Key Drivers of Diversification Cost Effectiveness
Brokerage Commissions and Fees
Per-trade fees, ranging from $0 to $10, can reduce the benefit of small, regular portfolio adjustments, especially for portfolios under $250,000.
Fund Expense Ratios Compared to ETF Costs
Actively managed diversified funds often charge 0.5–1.2% annually, while index ETFs can be as low as 0.03–0.20%, making fund choice a key cost factor.
Tax Implications from Turnover and Rebalancing Gains
Frequent rebalancing can trigger short-term capital gains, taxed at 22–37%, while "wash sale" rules prevent immediate deduction of certain losses.
Frequently Asked Questions on Diversification and Rising Costs
Can low-cost index funds fully replace diversified active portfolios?
Index funds provide broad market exposure at expense ratios as low as 0.03%, but may lag active strategies during sector rotations or volatile periods. However, they significantly reduce trading and tax friction, especially for buy-and-hold investors.
How often should an investor rebalance in a high-cost environment?
As transaction costs rise, optimal rebalancing intervals lengthen. Annual or threshold-based rebalancing—triggered when allocations deviate by 5–10%—can balance risk control with cost efficiency better than monthly or quarterly schedules.
Are there specific asset classes less affected by rising trading costs?
Buy-and-hold fixed income securities, such as municipal bonds, typically require less trading and may offer tax-advantaged income, reducing overall costs compared to frequent equity trades.
Key Takeaways: Balancing Cost and Diversification
What to remember
- Diversification continues to provide valuable risk mitigation, but rising transaction fees, taxes, and management expenses can reduce its net return advantage by 1–2% annually.
- Investors must weigh whether the incremental risk reduction from diversification justifies the clear financial drag of executing such strategies, especially in portfolios under $500,000.
- Simplified, concentrated portfolios can minimize frictional costs to below 0.5% per year, but expose investors to higher volatility and sector-specific risks.
- No single approach is universally superior; the choice depends on each household’s risk tolerance, investment horizon, and sensitivity to costs.
- Regularly reviewing fee structures, tax implications, and rebalancing strategies is essential to maintaining an effective balance between risk and return when investment costs climb.
How Rising Costs Influence Asset Allocation Strategies
As transaction fees and management expenses rise, traditional asset allocation—such as maintaining a 60/40 split between stocks and bonds—may no longer deliver optimal results if costs consume a significant share of returns. For portfolios under $250,000, frequent rebalancing can cost $200–$500 per year in commissions and trigger $1,000 or more in annual taxes. Less frequent rebalancing or the use of low-cost index funds, with expense ratios as low as 0.03%, can help preserve value in a high-cost environment. The choice between active and passive management also becomes more critical, as active funds can charge 0.8–1.2% in annual fees, offsetting potential outperformance in most years.
Cost increases affect asset classes unevenly. Fixed income investments, especially less liquid ones, often experience wider bid-ask spreads—sometimes 0.5% or more per trade—while equities may face higher exchange or regulatory fees. Private equity and hedge funds can charge management fees of 1–2% plus performance fees, which can total 15–25% of profits, compounding overall expenses. As a result, investors should assess both the diversification benefits and the cost structure of each asset class, aiming to balance risk reduction with expense sensitivity for long-term growth.
Hybrid approaches are emerging: investors may use broad-based ETFs for core holdings at ultra-low expense ratios, supplementing with select active funds only when clear cost-effective advantages exist. Tax-efficient vehicles, such as index funds with in-kind redemption features, can further reduce frictional costs. Implementing these strategies requires careful planning, but can help maintain diversification without excessive sacrifice to rising expenses.
Technology’s Role in Reducing Investment Costs
Technological advances are helping investors counteract rising costs. Robo-advisors—automated platforms using algorithms to manage portfolios—typically charge advisory fees between 0.15% and 0.35%, far below traditional human advisors who may charge 1% or more. These platforms automate rebalancing, often using tax-minimizing strategies and optimizing trade frequency to limit transaction costs. Commission-free trading, now widely available, allows investors to adjust portfolios without incurring $5–$10 per trade charges that were standard as recently as 2018.
Emerging technologies such as blockchain and decentralized finance (DeFi) are beginning to lower operational costs by reducing intermediaries and enabling fractional ownership. While still early-stage, these innovations could further compress trading fees and open new avenues for cost-efficient diversification. Artificial intelligence (AI) tools are also improving predictive analytics and risk assessment, allowing portfolio managers to make more precise allocation changes that maximize diversification benefits relative to incurred costs. As these technologies mature, they are likely to further reduce cost barriers to effective diversification, especially for portfolios between $50,000 and $500,000.
Behavioral Impacts of Higher Investment Costs
Rising costs can lead investors to alter behavior in ways that unintentionally undermine diversification. Some may avoid necessary rebalancing to sidestep $100–$300 in annual fees, allowing portfolios to drift and become overly concentrated. Others may attempt to offset costs by trading more frequently, only to amplify expenses—a cycle known as the "trading trap." Recognizing these behavioral biases is crucial for maintaining long-term diversification benefits.
Financial advisors can help by explaining the trade-offs between cost savings and risk control, and by recommending automated rebalancing or threshold-based strategies. For example, setting a 10% drift threshold before rebalancing can reduce trades by half compared to fixed quarterly schedules, saving hundreds in commissions and taxes over time. A holistic view—factoring in explicit fees, taxes, and opportunity costs—supports more disciplined adherence to diversification principles even as direct costs rise.
Case Study: Diversification Outcomes in Low- vs. High-Cost Portfolios
Consider two identical $100,000 portfolios, one with a low annual expense ratio of 0.10% and another with a higher ratio of 1.00%. Over 20 years, assuming a 6% annual gross return, the low-cost portfolio grows to roughly $320,700, while the high-cost portfolio reaches only about $268,500. This $52,200 difference—over 16% less wealth—results solely from cost drag, despite both portfolios enjoying similar diversification benefits during market downturns. This example highlights why integrating cost analysis is essential when evaluating diversification strategies.
Rising Transaction Costs and the Rebalancing Dilemma
Higher transaction costs can discourage regular portfolio rebalancing, a key practice for maintaining target asset allocations and managing risk. For example, if an investor with a $100,000 portfolio faces $10 per trade and rebalances quarterly across four asset classes, annual costs can reach $160—1.6% of the portfolio if only $10,000 is traded each time. This cost can deter timely rebalancing, causing allocations to drift and risk levels to rise unintentionally. Conversely, aggressive rebalancing in a high-fee environment can erode long-term returns through compounded expenses.
Threshold-based rebalancing—where trades occur only when allocations deviate by 5–10% from targets—can reduce trading frequency by 30–60% compared to calendar-based methods, offering a compromise between cost savings and risk control. While this approach may introduce slight timing risks, it aligns with the realities of rising transaction costs for most households.
Exploring Alternative Diversification Strategies in Costly Markets
With traditional diversification facing headwinds from higher costs, many investors are turning to low-cost passive vehicles like index funds or exchange-traded funds (ETFs). These products typically offer expense ratios between 0.03% and 0.20%, compared to 0.8–1.2% for actively managed funds. Factor-based investing—targeting characteristics like value or momentum through specialized ETFs—can also offer diversification without frequent trading, as these funds often rebalance only semiannually or annually. However, investors should remain aware of bid-ask spreads, which can range from 0.05% for liquid ETFs to over 0.5% for niche products, and potential tax implications.
Concentrated portfolios with fewer high-conviction positions can reduce trading costs, but increase exposure to company- or sector-specific risks. A blended approach—combining diversified low-cost ETFs with selective factor tilts—may offer a practical middle ground, keeping annual cost drag below 0.5% while maintaining broad market exposure.
Tax Efficiency: A Critical Factor in High-Cost Markets
Taxes are an often-overlooked component of investment costs. Capital gains taxes, especially on short-term gains (held less than one year), can range from 22% to 37%. Tax-loss harvesting—selling losing investments to offset gains—can help reduce tax bills, while holding positions for over a year typically qualifies gains for lower long-term rates (15–20%). Tax-advantaged accounts like IRAs and 401(k)s shelter gains from immediate taxation, and tax-efficient funds with low turnover minimize realized gains. For example, an investor realizing $5,000 in short-term gains could pay $1,600 in taxes at a 32% rate, but deferring or offsetting those gains can preserve more after-tax wealth.
Combining transaction cost management with tax-aware investing is essential for maintaining effective diversification. Ignoring either aspect can reduce net returns by 1–3% annually, even in well-diversified portfolios.
Leveraging Technology and Automation to Manage Costs
New tools help investors control the impact of rising costs. Robo-advisors automate portfolio management and rebalancing, often charging advisory fees as low as 0.15–0.35% per year. Algorithmic trading systems, long used by institutional investors, are now accessible to individuals through platforms offering fractional shares and commission-free trades. These technologies optimize trade execution, minimize unnecessary transactions, and provide real-time analytics, supporting disciplined adherence to diversification principles while keeping costs in check.
By integrating automation, even investors with modest portfolios—say $25,000 to $200,000—can maintain diversified allocations without incurring the high fees and frequent trading costs that once made such strategies prohibitive.
References
- https://www.investor.gov/introduction-investing/investing-basics/glossary/diversification
- https://www.finra.org/investors/investing/investing-basics/asset-allocation-diversification
- https://www.investor.gov/introduction-investing/investing-basics/glossary/expense-ratio
- https://www.investor.gov/introduction-investing/investing-basics/glossary/asset-allocation
- https://www.bls.gov/cpi/