
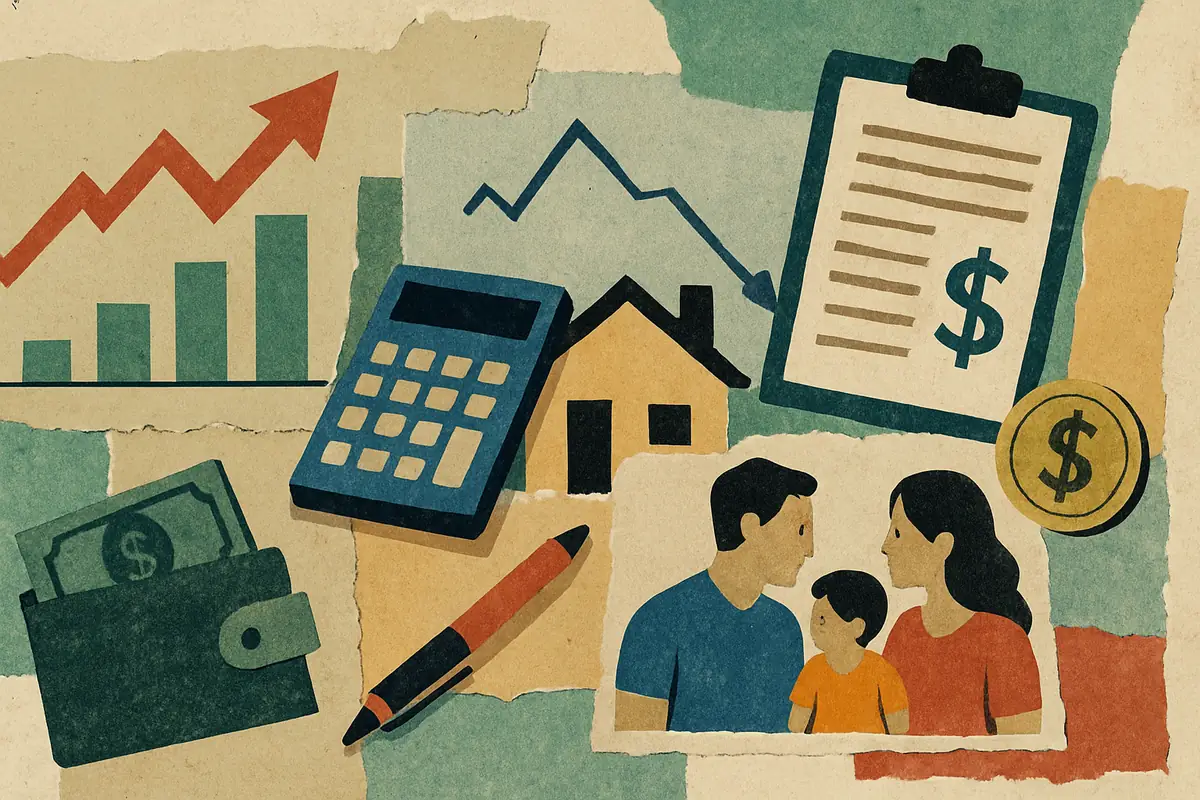
Scenario Four: Young Family Budgeting Under Stretched Income Growth
Young families managing annual household incomes between $80,000 and $110,000 often face rising living costs that outpace their wage growth, especially in urban areas where housing rents, childcare, and transportation costs can escalate rapidly. For example, childcare expenses in many metropolitan regions can reach $1,000 to $2,500 per month, while average rent increases of 8% to 15% annually are not uncommon. When cash flow analysis assumes expenses grow in line with inflation alone, it may miss how demographic changes—such as the arrival of a new child—can shift consumption patterns and introduce new recurring costs.
Consider a modeled young family earning $95,000 before taxes. If their rent rises from $2,200 to $2,464 per month (a 12% increase), that alone adds $3,168 in annual expenses. If nominal wage growth is limited to 2% per year, but inflation in their cost basket is running at 6%, their real purchasing power declines each quarter. Stress testing their budget by modeling scenarios where total living costs rise 5%, 10%, or 15% annually helps identify the break-even point—often, when non-discretionary expenses exceed 65% of after-tax income, standard budgeting becomes unsustainable without supplemental income or support such as tax credits, childcare subsidies, or a second job.
Conclusion: Model Adaptability Preserves the Utility of Cash Flow Analysis
Rising costs can undermine the accuracy of traditional cash flow analysis, especially when static assumptions are used. However, cash flow analysis remains a critical tool if models are adapted to real-world dynamics. By integrating forward-looking inflation expectations—such as projecting 4% to 7% annual cost increases for key expense categories—differentiating between fixed and variable costs, and applying sensitivity testing that examines 2%, 5%, and 10% inflation scenarios, analysts maintain the relevance of their forecasts. Adjusting discount rates, which reflect the time value of money and prevailing interest rates (commonly ranging from 5% to 9% in inflationary periods), further ensures valuations remain grounded in current economic conditions.
Rather than discarding established methods, decision-makers should recalibrate cash flow models to reflect evolving realities. Enhanced frameworks that incorporate these adjustments are better equipped to inform strategic decisions and risk management under rising cost pressures.
Adjusting Cash Flow Analysis to Inflationary Pressures
With annual inflation rates in many economies fluctuating between 3% and 8% over recent years, traditional cash flow analysis must be recalibrated to reflect the erosion of purchasing power. Nominal projections—those that ignore inflation—can overstate future profitability by failing to account for rising costs in labor, raw materials, and overheads. For example, if a business expects raw material costs to rise 7% annually and labor costs to increase 4% per year, these estimates must be built directly into the cash flow model.
Discount rates, which are used to calculate the present value of future cash flows, should also be adjusted upward in high-inflation environments. For instance, if the risk-free rate increases from 2% to 4% and the equity risk premium rises from 5% to 7%, the overall discount rate applied in net present value (NPV) calculations may move from 7% to 11%. This adjustment reduces the present value of future cash flows, reflecting increased opportunity costs and risk. Sensitivity analysis—testing the impact of 3%, 5%, or 10% inflation on projected cash flows—becomes indispensable for identifying at what point projects or investments become unprofitable. This approach helps investors set realistic contingency plans, such as including price escalation clauses in contracts or hedging commodity exposures, to help manage volatility.
Case Study: Manufacturing Sector Faces Escalating Input Costs
Consider a mid-sized manufacturer with $10 million in annual revenue, relying on metal inputs that have experienced price surges of 12% to 18% year-over-year. The company's original cash flow projections assumed stable input costs, but after observing a 15% annual increase, they revised their forecasts to build in a 10% yearly rise in raw material expenses for the next five years. This change reduced projected annual net cash flows from $1.2 million to $800,000, pushing certain product lines from a 10% margin to break-even or negative territory.
To address these pressures, the company negotiated three-year supply contracts to lock in current prices, pursued operational efficiencies that cut labor costs by 5%, and implemented a 6% price increase on select products. These measures restored positive margins on most lines. By updating their cash flow models to reflect these adaptations, management identified which products remained viable and where to allocate future investment.
Worked Calculation Example: Suppose the company’s annual raw material cost was $3 million. With a 10% increase, costs rise to $3.3 million. If operational savings reduce labor costs by $100,000 (from $1 million to $900,000) and a 6% price increase on 50% of products boosts revenue by $180,000, the net effect is: +$300,000 (raw material increase) - $100,000 (labor savings) + $180,000 (price increase) = $380,000 net additional annual costs. The revised cash flow projection incorporates this $380,000 reduction, providing a more accurate outlook.
Incorporating Non-Cash Costs and Capital Expenditures
Cost increases extend beyond immediate operating expenses to influence capital expenditures (CapEx) and non-cash items like depreciation. CapEx refers to funds used for purchasing or upgrading long-term assets such as equipment or facilities. Rising equipment prices—up 8% to 15% over the past two years for some categories—require companies to update capital budgets and cash flow forecasts accordingly. For example, if a planned equipment upgrade rises from $500,000 to $575,000 due to inflation, future free cash flow projections must reflect this higher outlay.
Non-cash charges, such as depreciation—the allocation of asset costs over their useful lives—may also need revision if replacement costs rise. While depreciation does not affect immediate cash balances, it reduces taxable income and can impact available cash for reinvestment or dividends. Analysts should ensure that both CapEx and depreciation schedules in financial models are updated to reflect current asset values and expected replacement costs, keeping financial statements aligned with economic reality.
Practical Recommendations for Investors in Rising Cost Environments
Investors analyzing companies during inflationary periods should request detailed breakdowns of expense growth assumptions and scrutinize management’s cost mitigation strategies. For example, a company facing 5% to 10% annual increases in input costs should demonstrate plans for efficiency gains or price adjustments. Assessing whether a business has pricing power—the ability to raise prices without losing significant sales volume—is crucial. Sectors like utilities or branded consumer goods often have more pricing power than commodity producers.
Comparing historical performance during previous inflationary cycles, such as 2008–2010 or 2021–2023, with current forecasts helps contextualize risk. However, forward-looking scenario planning is essential, given modern drivers like supply chain disruptions and geopolitical events. Engaging with management about contingency frameworks—such as maintaining liquidity reserves equal to at least three months of operating expenses—can provide confidence in a company’s ability to weather cost shocks.
Long-Term Implications for Financial Modeling
Persistent cost increases require a shift from static to dynamic financial models. This means regularly updating forecasts to reflect changes in macroeconomic indicators such as commodity price indices, wage growth (which may range from 3% to 6% annually in tight labor markets), and interest rates. Discount rates, which reflect both the time value of money and risk, may rise from 6% to 10% or more during periods of heightened uncertainty, reducing the present value of future cash flows.
Scenario-based modeling, which examines a range of possible outcomes rather than relying on single-point estimates, becomes increasingly valuable. For example, modeling outcomes under 3%, 6%, and 9% annual cost increases provides a probabilistic view of risk and reward, helping decision-makers allocate capital more effectively and build resilience into planning processes.
How Rising Costs Affect Cash Flow Metrics
Escalating costs, whether due to inflation, supply chain disruptions, or regulatory changes, can significantly alter a company’s cash flow profile. For instance, a 7% increase in operating expenses can reduce free cash flow margins from 12% to 8% in a single year, impacting both valuation and reinvestment capacity. Analysts must distinguish between temporary spikes—such as a one-time 15% increase in shipping costs—and long-term structural increases, like sustained 5% annual wage growth.
Each component of the cash flow statement is affected differently. Operating cash flow, derived from core business activities, is most sensitive to cost inflation, while investing cash flow may reflect increased CapEx as companies adapt to new cost realities. Financing cash flow can also be impacted if companies need to borrow to cover shortfalls or refinance at higher interest rates, with typical corporate loan rates rising from 4% to 7% during inflationary periods. A granular review of each line item helps analysts understand the true drivers of cash flow changes.
Integrating Inflation Scenarios into Cash Flow Forecasts
Inflation—defined as the general rise in prices across an economy—must be explicitly modeled in cash flow forecasts. Traditional models might assume 2% annual inflation, but recent periods have seen rates between 4% and 8%. Analysts should build baseline, moderate, and high-inflation scenarios, adjusting both revenue and cost projections accordingly. For example, if input costs rise 6% while revenues increase only 3%, profit margins will compress unless offset by efficiency gains or price increases.
Discount rates used in discounted cash flow (DCF) models must also be adjusted. If inflation expectations push nominal interest rates from 3% to 6%, the appropriate discount rate for valuing future cash flows may need to rise by a similar margin. This adjustment lowers the present value of future earnings, making accurate inflation modeling critical for investment analysis. Companies with the ability to pass through 70% to 100% of cost increases to customers are better positioned to maintain cash flow and valuation stability.
Examples of Cost Pressures Across Industries
Different industries experience rising costs in distinct ways. Manufacturing firms may see 10% to 20% annual increases in raw material prices, requiring frequent price adjustments or efficiency improvements. Technology companies, by contrast, often face 5% to 8% annual wage increases for skilled labor. Retailers have contended with 10% to 15% increases in logistics and transportation costs, particularly during supply chain bottlenecks.
Thin-margin businesses, such as grocery or discount retail, are especially vulnerable to cost inflation, as even a 2% to 3% increase can erode profitability. Understanding these sector-specific dynamics allows analysts to tailor cash flow assumptions and avoid overgeneralizing cost impacts across diverse industries.
Operational Strategies to Counteract Rising Costs
Companies employ a range of strategies to mitigate rising costs and protect cash flows. Renegotiating supplier contracts to secure fixed pricing, investing in automation to reduce labor dependency, and outsourcing non-core processes can lower variable expenses. For example, a manufacturer investing $200,000 in automation may reduce annual labor costs by $50,000, achieving payback in four years. Energy efficiency upgrades, such as switching to LED lighting or installing solar panels, can reduce utility costs by 10% to 20% over a five-year horizon.
Investors should evaluate management’s track record in implementing such initiatives. Firms that demonstrate agility and cost discipline—maintaining free cash flow margins above 8% during inflationary periods—tend to outperform peers and sustain higher valuations.
The Importance of Pricing Power for Cash Flow Sustainability
Pricing power—the ability to raise prices without significantly reducing sales volume—is a key determinant of cash flow resilience. Companies with strong brands or unique products can often pass through 60% to 100% of cost increases, while those in commoditized markets may only manage 10% to 30%. For example, a luxury goods producer may increase prices by 8% with minimal sales impact, whereas a commodity supplier may lose customers with a 3% price hike.
However, pricing power is not absolute. It depends on demand elasticity—how sensitive customers are to price changes—and competitive dynamics. Analyzing both historical price adjustments and current market conditions provides insight into the sustainability of cash flows when costs rise.
Takeaway: Adapting Cash Flow Analysis for Modern Cost Challenges
Understanding Inflation’s Impact on Cash Flow Analysis
Inflation, which has ranged from 2% to 9% annually in various economies since 2020, directly affects the reliability of cash flow analysis. When inflation is not properly accounted for, future cash inflows and outflows are overstated in real terms, potentially leading to flawed investment decisions. For example, a company projecting 5% annual revenue growth without considering 7% inflation may actually face declining real earnings.
Different cash flow components are affected in unique ways. Variable costs like materials and labor may rise rapidly, while fixed costs such as long-term leases may remain stable in nominal terms but fall in real value. Scenario analysis—modeling outcomes at 3%, 5%, and 8% inflation—helps stakeholders anticipate risks and develop contingency plans, such as hedging or renegotiating contracts, to protect against adverse outcomes.
Cost Management: A Pillar of Cash Flow Stability
Effective cost management is crucial for preserving cash flow integrity during inflationary periods. Techniques such as lean operations (streamlining processes to reduce waste), supplier negotiations (securing lower prices or better terms), and automation (replacing manual tasks with technology) can reduce variable costs by 5% to 15%. For example, investing $100,000 in automation might save a company $20,000 per year in labor costs, yielding a five-year payback.
Incorporating cost control initiatives into cash flow forecasts enables more accurate projections and demonstrates management’s proactive approach. Transparent reporting on these efforts builds investor confidence and signals robust governance in the face of rising costs.
Assessing Cash Flow Sensitivity to Cost Uncertainty
Sensitivity analysis quantifies how changes in key cost drivers affect cash flow outcomes. By modeling raw material price increases of 5%, 10%, and 20%, or labor cost hikes of 3%, 6%, and 9%, analysts can identify the thresholds at which cash flows turn negative. This process highlights which expenses have the greatest impact, guiding targeted risk mitigation.
For example, if a 10% increase in energy costs reduces net cash flow by $50,000, but a 10% rise in labor costs reduces it by $150,000, management may prioritize investments in energy efficiency only after addressing labor productivity. Sensitivity analysis also supports prudent capital allocation, especially when future cost volatility is high.
Examples of Adaptive Cash Flow Strategies During Inflation
Real-world adaptations include retailers passing through 3% to 7% price increases to offset higher freight costs, and technology firms investing in remote work infrastructure to limit wage inflation. Companies may also renegotiate payment terms with suppliers or lenders to smooth out short-term liquidity pressures caused by cost spikes.
Dynamic feedback loops—where cost increases trigger operational changes—keep forecasts accurate and actionable. For instance, a business might automatically evaluate supplier contracts for renegotiation if raw material costs rise by more than 8% in a quarter.
Scenario Planning: Strengthening Investment Decisions Amid Cost Volatility
Scenario planning involves creating detailed narratives that combine cost trends with other market factors, such as demand changes or regulatory shifts. For example, an energy company may model a scenario with a 15% annual fuel price increase and new emissions regulations, alongside a scenario with stable prices and technological advancements reducing costs by 5% per year.
Assigning probabilities and estimated impacts to each scenario enables more informed capital allocation and strategy development. This comprehensive approach helps businesses and investors prepare for a range of possible futures, rather than relying on single-point forecasts that may quickly become outdated.
Takeaway
References






