
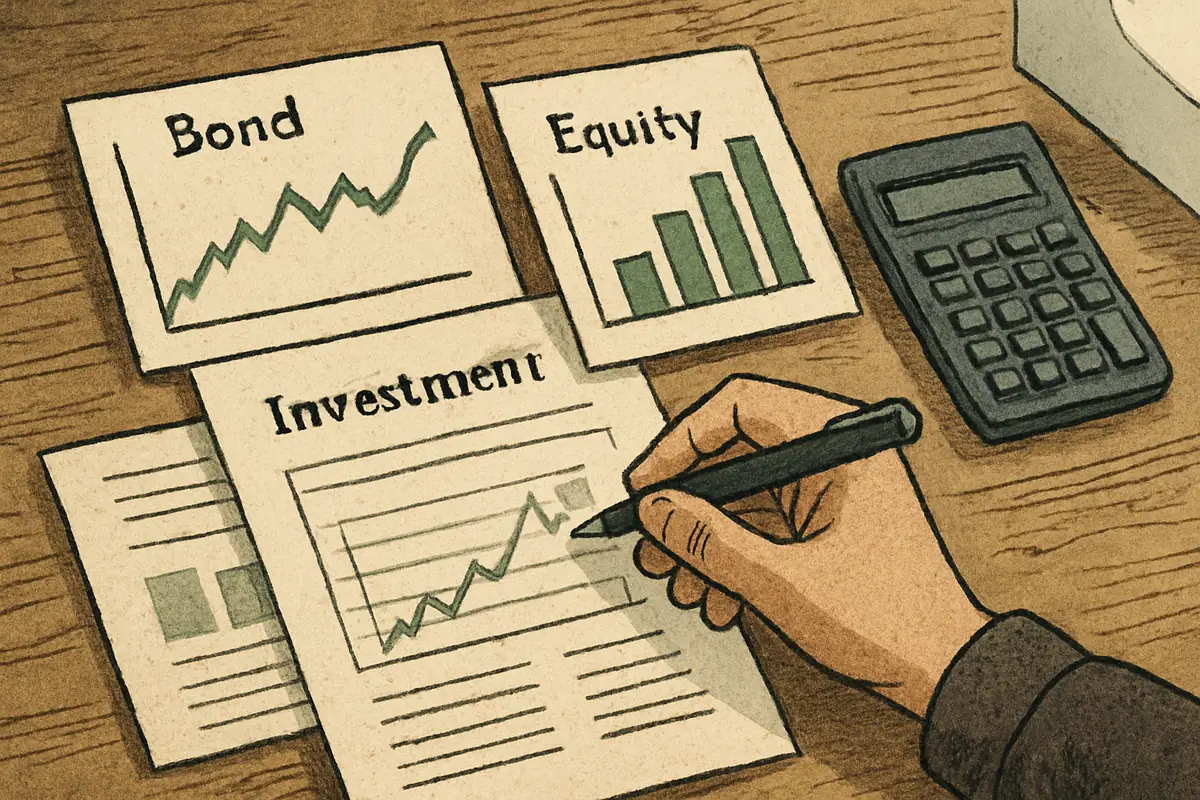
In mid-2022, U.S. consumer prices were climbing at an annual pace near 9 percent, the fastest in four decades. By 2025 the rate had cooled to roughly 2.5 to 3.5 percent, the overnight policy rate had eased back from above 5 percent, and the 10-year Treasury yield settled into a 4 to 4.5 percent band. For a retiree holding an $800,000 conservative portfolio, each of those shifts changed the math on income, principal risk, and purchasing power. This article examines whether an investor relying primarily on conservative assets should recalibrate around signals such as interest rates, inflation trends, and yield curve dynamics, or whether a fixed traditional allocation offers superior risk management.
Economic Signals as Portfolio Navigational Tools
The landscape of conservative investing is shaped by a fairly short list of macroeconomic signals. Interest rate trajectories, monthly inflation prints, and credit spreads — the extra yield a corporate bond pays over a Treasury of the same maturity — provide a framework for gauging shifts in risk premiums and liquidity conditions. Investment-grade spreads near 0.8 to 1.3 percentage points typically indicate calm credit markets; readings above 3 points, as seen during the 2008 crisis, signal genuine stress. A VIX reading of 12 to 20 reflects routine conditions, while spikes above 30 mark episodes when hedging turns expensive and correlations rise. These indicators can justify either holding a steady course or trimming exposure; the practical challenge lies in separating signals that warrant a tactical response from noise inside longer-term structural trends.
Conservative portfolios emphasize capital preservation and income stability, typically through bonds, high-grade credit instruments, and dividend-paying equities with defensive characteristics — utilities and consumer staples commonly yield 2 to 4 percent. The classic 60/40 stock-and-bond mix sits at the aggressive edge of this universe; many capital-preservation mandates run closer to 30/70 or 40/60. Sensitivity to economic data varies by asset: rising rates depress existing bond prices but lift future income, while inflation quietly erodes fixed coupons unless the portfolio holds inflation-protected securities. Understanding those interactions is foundational before any adjustment.
Interest Rate Movements: Implications for Fixed Income Holdings
Interest rates are the most direct economic signal influencing conservative allocations, particularly those skewed toward bonds. The 2022-2023 hiking cycle pushed the policy rate from near zero to above 5 percent, and intermediate bond funds posted double-digit price declines. The subsequent easing phase brought short-term rates back toward the low-4-percent area, illustrating both halves of the cycle: rising policy rates pressure existing bond valuations, yet they let maturing principal be reinvested at 4 to 5 percent instead of the 1 to 2 percent common in 2020-2021. Falling rates do the reverse, lifting prices while suppressing new income.
A worked example clarifies the trade-off. Step 1: an investor holds $250,000 in intermediate-term bonds with an average duration of six years — duration measures how much a bond's price moves when yields change. Step 2: market yields rise by one percentage point, or 100 basis points (a basis point is one one-hundredth of a percent). Step 3: the estimated price change equals duration times the rate move, so 6 times 1 percent produces a roughly 6 percent decline, about $15,000, leaving the position near $235,000. Step 4: the same move lifts the portfolio's yield from 4.5 percent to about 5.5 percent, raising annual income from $11,250 toward $13,750 as coupons and maturities are reinvested. Step 5: that extra $2,500 a year recoups the paper loss in roughly six years — approximately the portfolio's duration — which is why holders with horizons longer than their duration often beat sellers who lock in the decline.
| Interest Rate Environment | Portfolio Impact | Considerations |
|---|---|---|
| Rising Rates | Bond prices decline roughly 1 percent per year of duration for each 1-point rate rise; reinvestment yields improve toward 4-5 percent | Shorten duration; build a 1-to-5-year ladder; weigh inflation drag on real returns |
| Falling Rates | Prices appreciate; new-money yields compress, sometimes below 3 percent | Lock in longer maturities early; reinvestment risk grows; income budgets tighten |
| Stable Rates | Price swings moderate; income dominates total return | Focus on credit quality, diversification, and keeping fund expense ratios near 0.03-0.20 percent |
Rate expectations therefore inform not just how much fixed income to hold but its maturity structure. Ignoring the signal exposes investors either to avoidable price volatility or to years of suboptimal income.
Inflation Trends and Their Effect on Conservative Asset Classes
Inflation is the persistent threat to the real purchasing power of fixed income — the cornerstone of conservative strategies. The arithmetic is unforgiving: a bond yielding 4.5 percent against 3 percent inflation delivers only about 1.5 percent of real return, and during the 2022 spike, when prices rose near 9 percent, most nominal bonds produced deeply negative real results. Treasury Inflation-Protected Securities (TIPS), whose principal adjusts with the consumer price index, hedge that risk, but the market's breakeven rate — the inflation level at which TIPS and regular Treasuries perform equally — has recently hovered around 2.2 to 2.4 percent. Buying TIPS is effectively a bet that realized inflation will exceed that threshold; if inflation lands at 2 percent, the nominal bond wins.
Inflation also filters into the equity sleeve of conservative portfolios. Defensive sectors with pricing power — household staples, regulated utilities, healthcare — can pass through cost increases of 3 to 4 percent annually without destroying demand, but rapid spikes still compress margins. Monthly consumer price data, wage growth near 4 percent, and commodity moves therefore deserve attention when calibrating exposures.
Benefits of Inflation-Aware Adjustments
- Preserves purchasing power: at 3 percent inflation, $100,000 of buying power shrinks to about $74,000 over ten years if income does not keep pace
- Reduces vulnerability to shocks like the 2021-2022 surge from 2 percent to 9 percent
- Adds resilience in stagflation scenarios, where both stocks and nominal bonds struggle simultaneously
Challenges and Risks
- Inflation-linked instruments lag in disinflationary periods, as they did when CPI fell back toward 3 percent
- Specialized securities carry added complexity, and some inflation-hedge funds charge expense ratios of 0.30 to 0.75 percent versus 0.03 to 0.10 percent for plain index funds
- Hedging inflation with commodities or real assets can import equity-like volatility and unintended correlations
Whether inflation looks transitory or persistent shapes the choice between nominal instruments and inflation-hedged assets. An investor who expects CPI to hold in the 2.5 to 3.5 percent range might cap TIPS at 10 to 20 percent of the bond sleeve; one bracing for another spike would go further, accepting lower yield today as an insurance premium.
"Flight to Quality" Versus Yield-Seeking: Dynamic Allocation Trade-offs
"Flight to quality" describes episodes when risk aversion spikes — geopolitical shocks, banking stress, recession fears — and capital floods into government bonds and top-rated credits. The pattern is measurable: when the VIX jumps from the mid-teens past 30, 10-year Treasury yields often drop 0.3 to 0.5 percentage points within weeks as buyers accept less income for safety. That repricing rewards existing bondholders but compresses safe yields exactly when demand for safety peaks. Bear markets sharpen the effect. Equity drawdowns historically run 20 to 50 percent — U.S. stocks fell about 37 percent in 2008 — while high-grade bonds in most such episodes gained ground, the core diversification argument for holding them.
Yield-seeking is the mirror image. In calm stretches, with unemployment near 4 percent and spreads tight, investors drift down the quality ladder — into bonds rated a notch or two below investment grade yielding 6 to 8 percent, or into dividend payers yielding 3 to 4 percent with moderate volatility. The extra 1.5 to 3 percentage points of income is real, but so is the risk: lower-rated credit behaves like equity in a downturn, falling precisely when ballast is needed most.
The tension between these impulses defines conservative management. A disciplined middle path caps the yield-seeking sleeve — say, no more than 15 percent of the portfolio in below-investment-grade or high-dividend positions — so reaching for income never converts a capital-preservation mandate into a credit bet.
Yield Curve Dynamics: Reading Risk Premia Signals
The yield curve — the line tracing yields from 3-month bills out to 30-year bonds — is a compact summary of market expectations for growth, inflation, and policy. Normally it slopes upward, with long yields 1 to 2 percentage points above short ones as compensation for time. An inversion, where short yields exceed long ones, is the market pricing in future rate cuts; historically it has preceded U.S. recessions by roughly 6 to 24 months, hence the attention drawn by the deep 2022-2024 inversion, when 2-year yields ran as much as a full point above 10-year yields. A steepening curve signals the opposite: improving growth expectations, often accompanied by rising inflation risk.
Conservative investors can respond by repositioning along the curve. During inversions, an investor might hold maturities of 1 to 3 years, capturing short rates above 5 percent while limiting exposure to a downturn's credit fallout. When the curve steepens and 10-year yields sit at 4 to 4.5 percent, extending duration locks in that term premium before anticipated rate cuts pull the whole structure lower.
Such tactical shifts should rest on consistent interpretation of the data, not reflexive reaction. Inversions have produced false alarms, and a conservative framework where capital preservation supersedes opportunism argues for incremental moves — shifting duration by a year or two, not swinging from bills to 30-year bonds on a single signal.
Liquidity Conditions and Their Role in Conservative Asset Allocation
Liquidity — the ability to convert an asset to cash without a meaningful price concession — is frequently overlooked until it disappears. Treasuries normally trade with bid-ask spreads of a few hundredths of a percent; individual corporate bonds often cost 0.25 to 0.5 percent of value to trade in normal times and 1 percent or more in stress. In March 2020, even Treasury markets briefly seized, and some bond funds traded at discounts of 2 to 5 percent to the value of their holdings. For a cautious investor forced to raise $50,000 during such a window, the exit cost can exceed a full year of yield.
Monitoring liquidity metrics — dealer bid-ask spreads, trading volumes, the premium or discount on bond funds — complements macro analysis with ground-level insight into execution risk. Money market funds yielding 4 to 5 percent during the recent rate plateau gave conservative investors a liquid buffer that finally paid meaningfully.
Advantages of Monitoring Liquidity Signals
- Smoother execution when volatility spikes and the VIX pushes past 30
- Avoids forced selling at 2 to 5 percent discounts during dislocations
- Maintains operational flexibility to meet withdrawals — commonly 3 to 6 months of expenses held in cash equivalents
Caveats When Overemphasizing Liquidity Metrics
- Conditions can flip in days, as in early 2020, faster than most investors can react
- Excess caution has a price: sitting in cash yielding 4 percent forfeits the higher long-run returns of a diversified allocation
- In municipal and smaller corporate markets, liquidity data are opaque and often lag the actual deterioration
Balancing liquidity awareness with macro signals gives conservative investors both operational readiness and strategic positioning through regime shifts. No single indicator is decisive, but the combination supports measured allocation changes consistent with a capital-preservation mandate.
The Role of Valuation Metrics Under Different Economic Regimes
Economic signals matter not only for direction but for the valuation context they create. The near-zero rate era of 2020-2021 pushed bond valuations to extremes — 10-year yields near 1.5 percent left almost no cushion — whereas the current 4 to 4.5 percent range restores a genuine margin of safety: yields can fall and produce gains, or hold steady and still deliver income above trailing inflation of roughly 3 percent.
Credit valuations follow the same logic. High-quality corporate spreads near 1 percentage point offer little compensation for downgrade risk; spreads of 2 to 3 points during stress periods embed a much larger premium, historically attractive for patient buyers with multi-year horizons but unsuitable for investors who may need the money within a year or two.
Interpreting Economic Indicators for Portfolio Stability
Conservative investors lean on a familiar dashboard: inflation, unemployment, and gross domestic product (GDP) growth. Inflation directly attacks purchasing power; when it runs above the 2.5 to 3.5 percent range that has prevailed recently, investors tilt toward inflation-protected securities or shorter maturities to cut interest rate risk. Unemployment between 3.5 and 4.5 percent signals a healthy labor market supporting consumer spending and corporate earnings; a rise of half a percentage point off its low has historically been a reliable recession warning that prompts a shift toward utilities and consumer staples, which fall far less than the broad market while paying 2 to 4 percent dividends. GDP growth near the U.S. long-run trend of about 2 percent suggests stability; readings approaching zero flag volatility ahead and argue for migrating toward higher-quality assets. Reading these indicators together lets a cautious investor manage risk proactively while preserving capital.
Beyond the headline trio, forward-looking gauges add lead time. Purchasing managers' surveys of factory activity use 50 as the dividing line between expansion and contraction, and sustained readings in the mid-40s have preceded most modern downturns. A deteriorating survey trend might justify raising cash to 10 percent of the portfolio or emphasizing dividend payers with stable cash flows. Consumer sentiment surveys work similarly: confidence tends to roll over one to two quarters before household spending does. Together these signals form a mosaic that helps conservative investors trim exposure ahead of turbulence and re-enter recovery phases with measured optimism.
Central bank rate decisions remain the loudest signal of all. When the policy rate climbed past 5 percent to fight inflation, existing bond prices fell as new paper offered better yields, and investors holding long-duration funds absorbed losses of 10 percent or more. The standard defenses are shorter maturities and floating-rate notes — bonds whose coupons reset with benchmark rates every one to three months, holding price nearly steady as rates move. Higher rates also slow the economy by raising borrowing costs, an environment favoring non-cyclical sectors with strong balance sheets such as healthcare and consumer essentials. When easing begins, the logic reverses: equity valuations get support and borrowing costs fall, permitting modest additions to stocks. Rebalancing between fixed income and equities across these cycles — many practitioners use bands of plus or minus 5 percentage points around targets — keeps a conservative allocation genuinely stable.
Fiscal policy adds another layer. Infrastructure and social spending programs stimulate construction, materials, and technology services tied to public projects, and conservative investors sometimes tilt selectively toward those beneficiaries. But financing matters: with U.S. federal deficits recently running near 6 percent of GDP, heavier Treasury issuance can pressure long-term yields upward and revive inflation concerns. Persistent deficits of that scale push some cautious investors toward shorter sovereign maturities or modest international diversification to dilute single-country risk.
Global events supply shocks no domestic dashboard predicts. Trade disputes, armed conflicts, and pandemics can reprice assets worldwide in days — in the sharpest such episodes, equity markets have dropped 30 percent in roughly a month. Conservative investors buffer this with safe havens such as gold and government bonds of stable issuers. Currency swings matter too; a 10 percent move in the dollar materially changes returns on unhedged international holdings, so many conservative mandates hedge foreign bond exposure while leaving some equity exposure unhedged for diversification.
Structural shifts driven by macro conditions also shape long-horizon positioning. Energy price spikes accelerated investment in renewables, a sector supported by multi-decade demand trends. Demographics push the same direction: with the 65-and-over share of the U.S. population approaching one in five, healthcare demand grows on a schedule no business cycle interrupts, giving the sector defensive cash flows attractive to conservative strategies seeking growth without excessive volatility.
Discipline binds all of this together. Reacting to every data release is a losing game — monthly figures are noisy and frequently revised. A quarterly review cadence, aligned with updated economic forecasts, converts signals into measured adjustments rather than wholesale reallocations. Scenario analysis strengthens the process: modeling a stagflation case, a synchronized global slowdown, and a soft landing reveals which holdings are vulnerable in advance, and drawdown arithmetic keeps expectations honest — a portfolio that falls 30 percent needs a 43 percent gain to recover; one that falls 10 percent needs only 11 percent.
Practical Steps for Conservative Investors Using Economic Signals
Translating signals into action can be systematized. Hold 3 to 6 months of expenses in cash equivalents yielding 4 to 5 percent so no market event forces a sale. Ladder bonds across 1-to-5-year maturities to neutralize rate-timing guesses. Watch three numbers monthly — CPI relative to the 2.5-to-3.5 percent range, unemployment relative to 4 percent, and the gap between 2-year and 10-year yields — and act only when at least two move together for a quarter. Rebalance when allocations drift 5 percentage points from target, and keep implementation cheap: broad index funds charging 0.03 to 0.10 percent leave far more compounding intact over twenty years than specialized products charging 0.75 percent. Signals inform the plan; the plan, not the signal of the week, runs the portfolio.






