
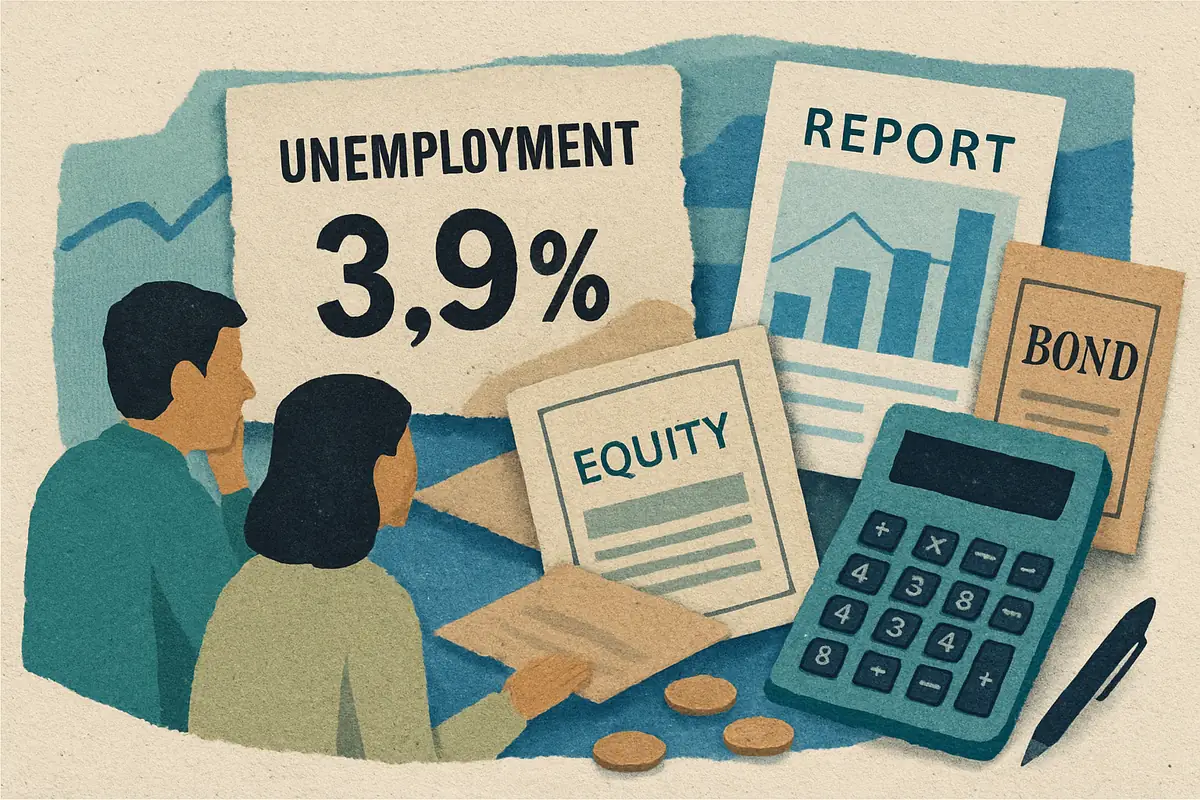
A rise in the headline unemployment rate from 4.1% to 4.3% represents roughly 300,000 additional people out of work in a labor force of about 170 million—and a surprise of that size can knock 1–2% off broad US stock indexes in a single trading session. In early spring, a suburban family pores over exactly this kind of release, unease building as they connect the jobless uptick to their own mortgage payment and grocery bills. Their financial advisor offers a caution: markets rarely react to the number itself. They react to the gap between the number and what investors expected, filtered through moods shaped by recent volatility and central bank signaling. This moment captures a crucial intersection where raw economic data meets human perception—driving market reactions in ways that extend well beyond the statistics themselves.
Market Observation: The Weight of Expectations in Economic Data
Economic indicators rarely operate in isolation. Market participants enter each data release with expectations built from past trends, media narratives, and central bank guidance. Consider inflation. After consumer prices peaked near 9% annually in mid-2022, US inflation cooled into a 2.5–3.5% range—yet a monthly reading just 0.1 percentage point above forecast can still push the 10-year Treasury yield, which has recently traded in a 4–4.5% band, sharply higher within minutes. The absolute figure matters less than the surprise. When the short-term policy rate sat above 5% following the 2022–2023 hiking cycle, every decimal point of inflation data was read as a clue about how long borrowing costs would stay elevated, and investors' psychological readiness to reposition magnified or muted each signal.
This dynamic stems from cognitive biases. Anchoring means leaning too heavily on the first number you encountered—say, the 9% inflation peak—so that a later 3% print still feels alarming. Confirmation bias means favoring evidence that agrees with what you already believe and discounting the rest. Timing within the economic cycle matters too. During an expansion, inflation running at 3% may be tolerated as a sign of healthy demand; during a slowdown, the identical figure can provoke fears of renewed tightening. Same data, opposite reactions—the difference is entirely psychological context.
Scenario Analysis: Household Response to Inflation Reports
How this can look in practice
Consider a household earning $6,500 a month before taxes. The latest inflation report shows a 0.5% month-over-month increase—roughly a 6% annualized pace if it persisted. On a $900 monthly grocery budget, that is only about $4.50 of immediate drift, yet the family responds as though far more is at stake: they postpone a $1,200 furniture purchase, trim $250 from monthly discretionary spending, and move their $8,000 cash cushion from a large-bank account paying under 0.5% into a high-yield savings account earning 3.5–4.5% APY. The report did not change their income by a dollar. It changed how vulnerable they felt.
That reaction is not irrational—surveys have long found that roughly 4 in 10 US adults would struggle to cover a surprise $400 expense from cash on hand, so even modest price pressure feels threatening to households with thin buffers. The scenario also illustrates how indicators translate into decisions far beyond institutional trading desks. Millions of small behavioral shifts—delayed purchases, higher savings rates, cheaper substitutions—aggregate into measurable changes in demand across sectors, feeding back into the very statistics that triggered the caution.
Policymakers face a parallel challenge: communicating adjustments to forecasts or interventions without igniting outsized emotional responses. A single phrase in a central bank statement can move bond yields by 0.10–0.20 percentage points and ripple through currency values, because markets parse tone as much as content.
Pros and Cons of Relying on Economic Indicators for Investment Decisions
Where this helps
- Provides quantifiable benchmarks—inflation near a 2–3% target, unemployment near 4%—to assess economic health and guide portfolio allocation.
- Enables anticipation of monetary policy shifts by tracking inflation, employment, and growth data before rate decisions arrive.
- Feeds valuation models that incorporate cyclical factors, discount rates, and risk premium adjustments.
Where caution is needed
- Indicators lag real-time developments; monthly jobs figures are routinely revised by tens of thousands of positions in later releases.
- Market sentiment can distort interpretation, producing overreactions to noise and underreactions to genuine turning points.
- Statistical revisions and methodology changes create inconsistencies that complicate trend analysis.
Institutional investors integrate economic indicators within frameworks that weigh liquidity conditions, shifts in risk appetite, and the shape of the yield curve—the gap between short-term and long-term interest rates that often signals expectations about growth. Overreliance on headline releases without that context risks mispricing assets whenever psychology dominates.
During stretches of geopolitical tension, even strong data may fail to lift markets if fear premiums overwhelm fundamentals; the VIX volatility gauge, which typically sits between 12 and 20 in calm markets, can spike above 30 and stay there while investors ignore good news entirely. Conversely, euphoric sentiment can inflate asset bubbles even as underlying metrics deteriorate.
Comparative Insight: Economic Indicator Interpretation Across Cycles
"The same piece of data can evoke distinctly different market behaviors depending on where we are in the cycle," says a veteran analyst familiar with macro strategy. "A 3% inflation print during an early recovery reads as healthy demand returning. The identical 3% two years after a spike toward 9% reads as unfinished business that keeps rates elevated. Understanding this fluid context is key rather than treating every release as an isolated event."
Scenario Card: A Family's Investment Decision Amid Mixed Signals
How this can look in practice
The Johnsons have just received a quarterly statement showing their $400,000 portfolio, split 60/40 between stocks and bonds, gained modestly despite choppy equity markets. Headlines warn about persistent wage inflation, while central bank rhetoric hints at pausing further rate increases. Their mortgage, refinanced at 6.5% when 30-year rates ranged between 6% and 7%, costs them about $500 more per month than their old loan did. Two friends in their circle were recently laid off. The question on the kitchen table: move a slice of the portfolio to cash, or stay fully invested?
Running the numbers clarifies the trade-off. Step one: shifting $40,000—10% of the portfolio—into a high-yield savings account at 4.0% APY would earn about $1,600 in interest over a year. Step two: leaving that $40,000 in a diversified stock allocation with a long-run average near 10% nominal annual return implies roughly $4,000 of expected growth, though with wide year-to-year swings. Step three: the expected opportunity cost of de-risking is therefore $4,000 minus $1,600, or about $2,400 per year—roughly 0.6% of the total portfolio. Step four: weigh that cost against the protection purchased. In a severe bear market—historically drawdowns run 20–50%, and 2008 delivered roughly a 37% loss for US stocks—that $40,000 equity stake could temporarily shrink toward $25,000, while the cash would hold its value. The Johnsons are not choosing between right and wrong; they are pricing peace of mind at about $2,400 a year.
This dilemma shows how fear of loss and fear of missing out interact with genuinely mixed economic messages, and why framing often shapes outcomes more than analysis does. Advisors who work with institutional discipline encourage households like the Johnsons to evaluate such decisions through several lenses at once: valuations relative to historical norms, interest rate trajectories that affect debt costs, and the liquidity they realistically need for the next 6–12 months.
Info Menu: Key Psychological Concepts Affecting Economic Indicator Perception
A short glossary of the forces at work when investors read economic reports:
- Anchoring: over-weighting the first figure encountered, such as judging every inflation print against the 9% peak rather than the 2–3% target zone.
- Confirmation bias: seeking data that supports an existing view while dismissing contradictions.
- Loss aversion: the tendency for losses to feel roughly twice as painful as equivalent gains feel good, which skews reactions to negative reports.
- Availability bias: judging likelihood by whatever is most vivid or recent, such as one dramatic factory-closure story outweighing broad hiring data.
- Herding: copying the crowd's trades instead of independent analysis.
- Framing: reacting to how a statistic is presented rather than what it says.
Recognizing these biases helps analysts calibrate responses to economic reports more rationally and explains why markets can diverge sharply from model-based predictions during periods of heightened uncertainty.
FAQ: Common Questions About Economic Indicators and Investor Psychology
Why do markets sometimes move opposite to what economic data suggests?
Markets price in expectations before the release. If traders anticipated a strong jobs report, an equally strong actual number can trigger selling as positions unwind. "Good news is bad news" episodes are common when robust data raises the odds that policy rates stay above 5% longer, outweighing the growth signal itself.
How can individual investors better understand mixed economic signals?
Focus on trend consistency across 3–6 months of releases rather than any single report, and read each indicator alongside the policy backdrop. One soft retail month means little; three consecutive declines paired with rising jobless claims is a pattern worth respecting.
Are all economic indicators equally important for investment decisions?
No. Leading indicators such as building permits and new manufacturing orders offer foresight but are noisy; lagging indicators like the unemployment rate confirm trends only after they are established; coincident indicators describe the present without predicting anything. Weight them accordingly.
Can investor psychology be quantified effectively?
Imperfectly, yes. The VIX serves as a fear gauge—readings of 12–20 suggest calm, sustained levels above 30 signal stress. Weekly fund-flow data reveals where money is actually moving, and sentiment surveys of consumers and investors round out the picture of collective mood.
Strategic Reflection: Integrating Behavioral Awareness Into Macroeconomic Analysis
For professional investors, success hinges not solely on digesting headline statistics but on appreciating the psychological filters through which markets process them. Asset valuation is tied to cycles of liquidity provision by central banks, to risk premiums that expand and contract with confidence, and to rate expectations informed by both hard data and behavioral tendencies. When dividend yields on quality stocks sit in a 1–4% range while cash pays a comparable 4–5%, the psychological pull toward safety intensifies—even for investors whose time horizons argue for staying invested.
Strategies grounded in this layered understanding avoid overreacting to transient noise while positioning opportunistically when sentiment extremes create mispricings. Cost discipline compounds the advantage: broad index funds charging 0.03–0.75% in annual expenses leave more return in the investor's pocket than layering on advisory fees near 1% of assets, particularly in years when expected returns are modest. Behavioral awareness, in other words, pairs naturally with structural efficiency.
Ultimately, economics is not a mechanical aggregation of statistics but a social science, and that teaches humility: no single indicator dictates outcomes, and human psychology remains a potent force shaping markets at every turn.
Emotional Biases Influencing Economic Interpretation
Economic indicators, while data-driven, are interpreted through the lens of human emotion. An investor already braced for recession will emphasize a weak manufacturing survey while waving off two solid employment reports—confirmation bias in action. This emotional skew produces market moves out of proportion to fundamentals: single-day swings of 2–3% in equity indexes on data surprises that alter the long-run economic picture barely at all. Recognizing the skew is the first step toward interpreting reports objectively rather than emotionally.
Loss aversion compounds the problem. Because losses register roughly twice as intensely as equivalent gains, investors overreact to negative surprises such as an inflation uptick or a rise in jobless claims. The practical damage shows up in behavior: selling after a 20% drawdown locks in the loss, and investors who retreat to cash frequently miss the sharp early rebound—historically, a large share of a recovery's gains arrive in its first weeks. Discipline means judging each report against multi-month trends, not against the fear it momentarily produces.
The Role of Herd Mentality in Economic Forecasting
Herd mentality is the tendency to mimic the crowd rather than trust independent analysis. When a majority of forecasters turn pessimistic or euphoric about the same data, others follow without examining the numbers themselves. This collective behavior inflates bubbles during optimistic stretches and deepens sell-offs during pessimistic ones. The pattern is old and reliable: assets attract the most buyers after prices have already risen 30% or more, and the most sellers after they have already fallen.
During quarters when GDP growth runs above its roughly 2% long-term US trend, capital often floods into equities even as warning signs—rising corporate debt loads, stretched valuations, geopolitical friction—accumulate quietly. Conversely, a sharp drop in consumer confidence indices can trigger cascading sales even when employment, wages, and spending remain stable. Contagious sentiment moves not just individual portfolios but entire market cycles, which is why contrarian discipline is scarce and periodically very well rewarded.
Cognitive Load and Information Overwhelm
The sheer volume of economic data strains even seasoned professionals. A typical month brings dozens of significant US releases—employment, inflation, housing starts, retail sales, industrial production, consumer sentiment, and more—each with its own methodology, seasonal adjustments, and revision schedule. Overwhelmed, people reach for heuristics: mental shortcuts that simplify decisions but invite error. Reading only headline numbers while ignoring composition—such as a jobs gain concentrated in part-time positions—is a classic example.
Media coverage intensifies the load by compressing dense statistics into emotional headlines engineered for clicks rather than comprehension. That environment rewards snap judgments and reactive trading over measured analysis. Acknowledging the hard limits of human attention argues for a deliberately narrow process: track a handful of indicators consistently, read the underlying tables rather than the coverage, and let everything else remain background noise.
Impact of Psychological Anchoring on Market Expectations
Anchoring fixes attention on an initial reference point and drags every later judgment toward it. In markets, an early-year report of strong growth can anchor expectations of continued expansion even as mid-cycle data deteriorates; investors undervalue the new evidence because the old benchmark still dominates their thinking. The result is delayed adaptation—markets that respond to turning points months after the data first signaled them.
Housing offers a vivid case. Buyers anchored to the sub-3% mortgage rates of the pandemic era have spent years treating 6–7% loans as temporary aberrations, delaying purchases while waiting for a return to conditions that were themselves the anomaly. Breaking an anchor requires deliberate reassessment: asking what decision the current numbers justify on their own, as though the reference point had never existed.
The Influence of Media Framing on Economic Sentiment
Framing describes how presentation shapes perception. The same release can be reported as "unemployment rises to 4.2%" or "unemployment holds near half-century lows"—both accurate, each producing a different emotional response. Media outlets frame indicators optimistically or pessimistically through selective emphasis, and that framing shapes public sentiment and investor confidence out of proportion to the underlying data.
Soft language does much of the work: "concerns," "fears," and "warning signs" inserted into coverage amplify anxiety among readers without the technical background to evaluate the raw figures. The defense is straightforward—compare multiple sources, go to the official statistical tables directly, and note whether a story cites the actual numbers or merely reactions to them—before adjusting a portfolio based on reported mood.
The Role of Cognitive Biases in Interpreting Economic Data
Cognitive biases systematically distort how investors and analysts read indicators. Confirmation bias filters the flow of data toward whatever supports an existing recession or boom thesis. Anchoring lets an early estimate dominate even after revisions overturn it—an initial report of strong job growth can shape positioning for months after later data marks it down substantially. Because indicators are interpreted through psychology rather than absorbed as raw fact, the same statistical release can support opposite conclusions depending on who is reading it and what they already believed.
Availability bias adds another layer: recent, vivid, heavily publicized events crowd out representative ones. A prominent factory-closure story can create an exaggerated impression of industrial decline even while broader production data shows expansion across most sectors. The imbalance moves asset prices disproportionately. The countermeasure is procedural rather than heroic—consult several independent data series, check revision histories, and deliberately seek the strongest case against your current view before acting on any single report.
Fear and greed complete the distortion. Volatility after a poor inflation or growth report can trigger panic selling; upside surprises breed the overconfidence that inflates bubbles. Systematic approaches blunt both edges: rule-based rebalancing, dollar-cost averaging on a fixed schedule, and predetermined allocation bands keep decisions tethered to plan rather than to the emotional charge of the latest release.
Economic Indicators as Self-Fulfilling Prophecies
The psychological impact of indicators extends beyond interpretation to shaping outcomes. Because consumer spending drives roughly two-thirds of US economic output, expectations themselves become economic forces. If households anticipate a downturn after weak employment data, they cut spending preemptively—and that retrenchment slows growth enough to validate the original fear. Businesses behave the same way, freezing hiring and shelving investment in response to pessimistic signals even when their own order books remain healthy.
Collective expectations are powerful enough that central banks manage them deliberately through forward guidance—public communication about the likely path of interest rates, designed to influence borrowing and investment behavior before any policy change occurs. A credible signal that rates will fall by half a percentage point over the coming year can loosen financial conditions months before the first actual cut, purely by shifting what people expect.
This dynamic makes transparency and credibility in official statistics genuinely valuable. Abrupt revisions or inconsistent methodology erode confidence and produce erratic reactions that amplify volatility rather than dampen it, which is why statistical agencies publish detailed methods, pre-announced release calendars, and documented revision procedures.
Practical Strategies for Investors Navigating Psychological Pitfalls
Investors can build defenses against these psychological traps. The first is horizon discipline: reacting to quarterly and annual trends rather than monthly prints, which are often noise. An employment report read alongside wage growth and labor-force participation over the past year tells a far more reliable story than any single month's headline. The second is source diversification—pairing quantitative releases with qualitative evidence such as corporate earnings commentary and consumer sentiment surveys, so no single number or narrative dominates.
Structural buffers matter as much as analytical ones. An emergency fund covering 3–6 months of expenses—6–9 months for variable-income households—held in an insured account (US deposit insurance covers $250,000 per depositor, per bank, per ownership category) removes the desperation that forces selling at the worst moments. An investor who does not need the portfolio for next month's bills can afford to let a scary data release pass without acting on it.
Finally, predetermined rules strip emotion from execution. Rebalancing whenever an allocation drifts 5 percentage points from target, automating contributions on a fixed schedule, and writing down in advance what evidence would justify a strategy change all convert psychology from an adversary into a managed variable. The indicators will keep arriving, and sentiment will keep swinging; a rules-based process is what keeps one household's decisions anchored to plan while the crowd chases the latest headline.






